Office Space
500 Davis Street Evanston, IL 60201
500 Davis Street Evanston, IL 60201
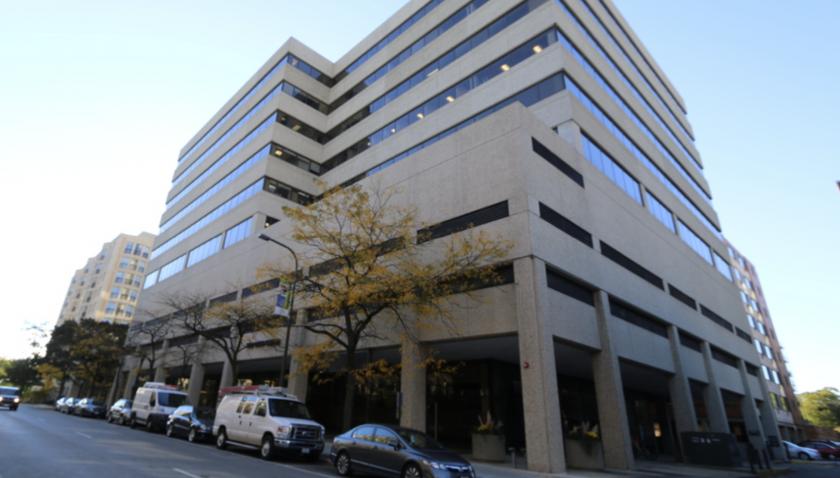
Details & Description
Property Highlights
- • Spectacular Lake Michigan views
- • On-site management engaged ownership
- • CTA and Metra rail lines within walking distance
Additional Photos


Listing Agents

Jack Reardon
O: 630-693-0647
M: 847-877-9466
jreardon@hiffman.com
O: 630-693-0647
M: 847-877-9466
jreardon@hiffman.com

Jason Wurtz
NAI Hiffman
O: 630-693-0692
M: 847-660-3839
jwurtz@hiffman.com
NAI Hiffman
O: 630-693-0692
M: 847-660-3839
jwurtz@hiffman.com
While we strive to provide the most accurate information, all listing information, and demographic data, is provided by third-parties. As such, MyEListing will not be responsible for the accuracy of the information. It is strongly recommended that you verify all information with the listing agent, and any relevant agencies, prior to making any decisions.


