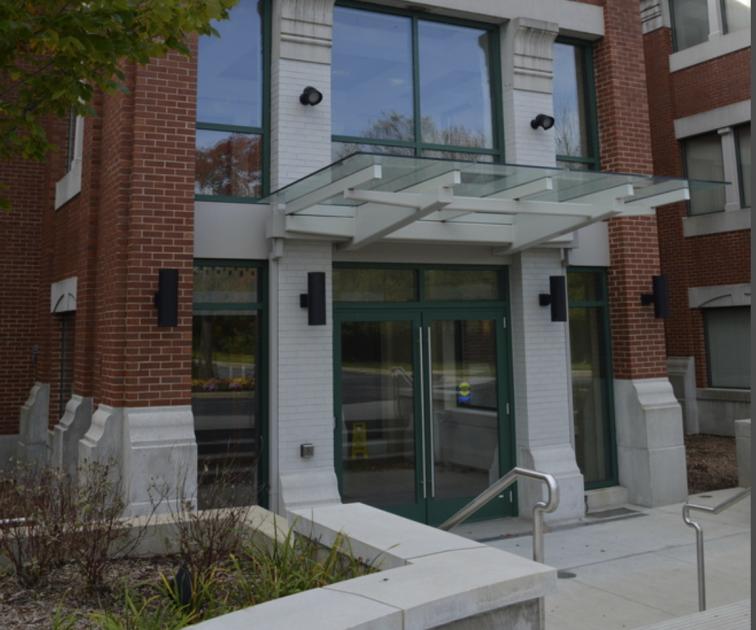
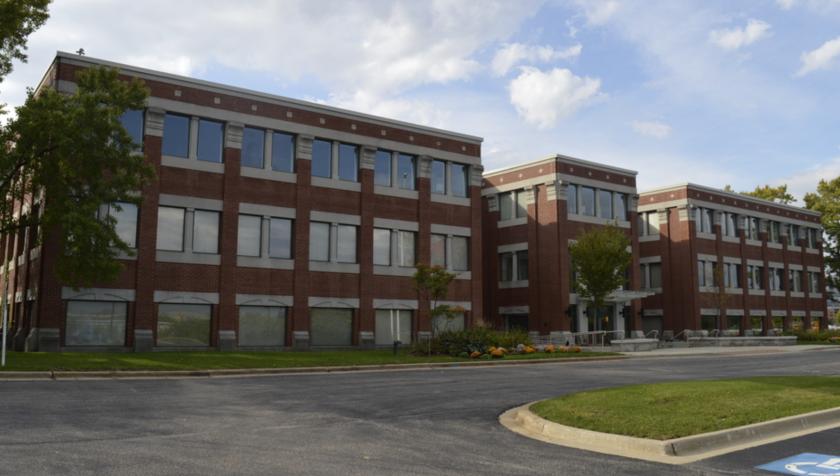
1-Mile | 3-Miles | 5-Miles | ||
---|---|---|---|---|
Total Population | 7,021 | 59,962 | 193,072 | |
Population Median Age | 39 | 42 | 42 | |
Population by Age | 0-9 Yrs | 933 (13%) | 6942 (11%) | 22720 (11%) |
10-19 Yrs | 1200 (17%) | 8518 (14%) | 25762 (13%) | |
20-29 Yrs | 416 (5%) | 4924 (8%) | 16145 (8%) | |
30-39 Yrs | 761 (10%) | 6044 (10%) | 22433 (11%) | |
40-49 Yrs | 1126 (16%) | 8250 (13%) | 26354 (13%) | |
50-59 Yrs | 1078 (15%) | 8887 (14%) | 27908 (14%) | |
60-69 Yrs | 913 (13%) | 7784 (12%) | 24988 (12%) | |
70+ Yrs | 593 (8%) | 8614 (14%) | 26762 (13%) | |
Median HH Income | $159,563 | $129,526 | $106,927 | |
Total Household Income | < 24K | 129 (5%) | 1824 (8%) | 7656 (10%) |
25-49K | 146 (5%) | 2432 (11%) | 10159 (13%) | |
50-74K | 172 (6%) | 2207 (10%) | 8899 (12%) | |
75-99K | 197 (8%) | 1968 (8%) | 7697 (10%) | |
100-199K | 928 (37%) | 6930 (31%) | 20899 (28%) | |
200K+ | 888 (36%) | 6649 (30%) | 17490 (24%) | |
Highest Education Level | No Diploma | 55 | 1436 | 8028 |
Diploma or GED | 258 | 4154 | 18683 | |
Some College | 517 | 5455 | 18799 | |
Assoc. Degree | 91 | 1497 | 6396 | |
Bachelors Degree | 1819 | 14711 | 44345 | |
Higher Degree | 1877 | 14172 | 39983 | |
Total Housing Units | 2,623 | 23,504 | 77,091 | |
--Owner-Occupied | 2,115 | 18,039 | 54,829 | |
--Renter-Occupied | 344 | 3,970 | 17,972 | |
Owner-Occupied Values | < 100K | 42 | 393 | 2348 |
100-199K | 61 | 1194 | 6408 | |
200-299K | 40 | 1900 | 7267 | |
300-399K | 375 | 2442 | 8366 | |
400-499K | 396 | 2830 | 7664 | |
500K+ | 1200 | 9281 | 22775 | |
Total Working Age Population | 5,319 | 47,603 | 154,137 | |
In Work Force | 3,776 | 30,642 | 101,152 | |
Not In Work Force | 1,543 | 16,961 | 52,984 | |
Workforce Employed | 3,678 | 29,324 | 97,275 | |
Workforce Unemployed | 93 | 1,299 | 3,603 | |
Civlian Workforce | 3,771 | 30,623 | 100,878 | |
Military Workforce | 5 | 19 | 274 | |
Total Households | 2,459 | 22,010 | 72,801 | |
Family Households | 2,037 | 16,799 | 52,580 | |
Non-Family Households | 423 | 5,211 | 20,221 | |
Married Couple | 1,801 | 14,925 | 45,284 | |
Other Family | 236 | 1,874 | 7,295 | |
Married w/Child | 901 | 6,482 | 19,488 | |
Single Male w/Child | 22 | 137 | 974 | |
Single Female w/Child | 112 | 827 | 2,540 |
Population Change Last Two Decades - Plus Projection
2000 | % | 2010 | % | 2020 | % | 2030 | |
---|---|---|---|---|---|---|---|
Illinois | 12,419,293 | +3 | 12,830,632 | +12 | 14,316,487 | +6 | 15,138,849 |
Cook County | 5,376,741 | -3 | 5,194,675 | +10 | 5,707,832 | +5 | 5,990,243 |
Lake County | 644,356 | +9 | 703,462 | +17 | 820,250 | +6 | 873,024 |
Total Working Age Population:
Total Households:
Total Working Age Population:
Total Households:
Total Working Age Population:
Total Households: