Industrial Properties
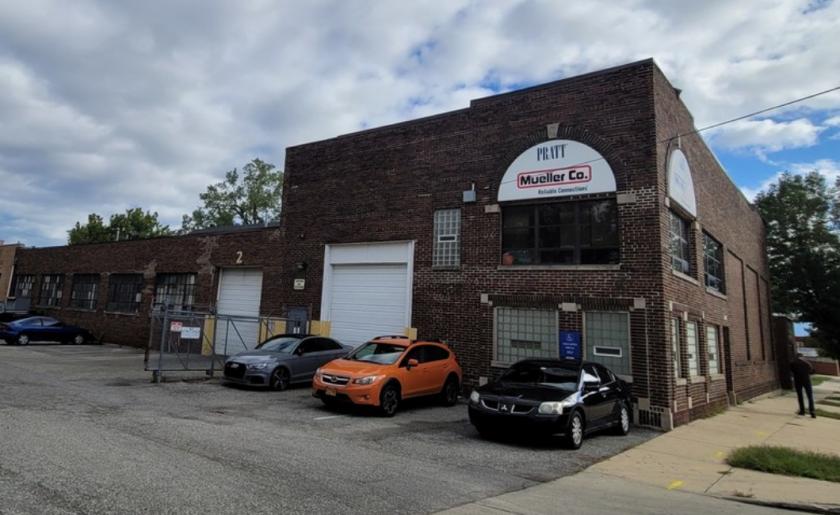
403 Conkey Street Hammond, IN 46324
403 Conkey Street Hammond, IN 46324
Details & Description
Property Highlights
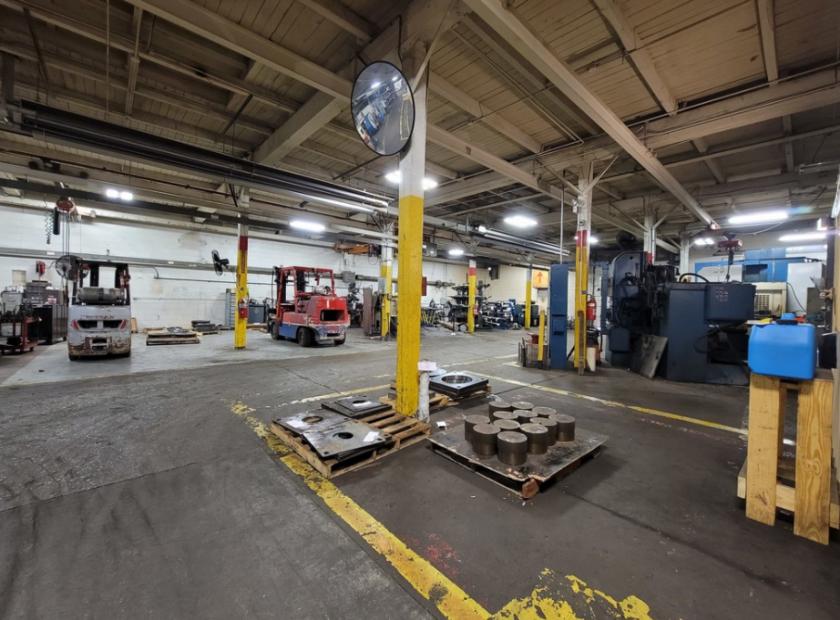
- • Office space 3,000 SF 2 floors
- • Cranes 8
- • Clear height 15 - 21
- • Car parking 30
- • Taxes $26,520 2018
- • Acres 2.00
Listing Agents

Chris Gary
NAI Hiffman
O: 630-693-0694
M: 708-712-9200
cgary@hiffman.com
NAI Hiffman
O: 630-693-0694
M: 708-712-9200
cgary@hiffman.com

Joe Bronson
O: 630-317-0725
M: 708-308-1155
jbronson@hiffman.com
O: 630-317-0725
M: 708-308-1155
jbronson@hiffman.com

Josh Will
NAI Hiffman
O: 630-317-0794
M: 630-317-0794
jwill@hiffman.com
NAI Hiffman
O: 630-317-0794
M: 630-317-0794
jwill@hiffman.com
While we strive to provide the most accurate information, all listing information, and demographic data, is provided by third-parties. As such, MyEListing will not be responsible for the accuracy of the information. It is strongly recommended that you verify all information with the listing agent, and any relevant agencies, prior to making any decisions.