Industrial Properties
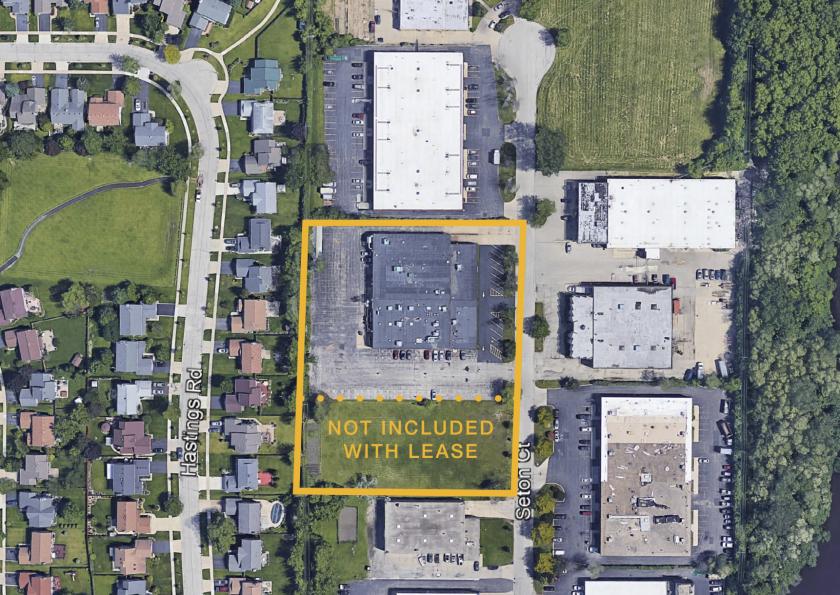
852 Seton Court Wheeling, IL 60090
852 Seton Court Wheeling, IL 60090
Details & Description
Property Highlights
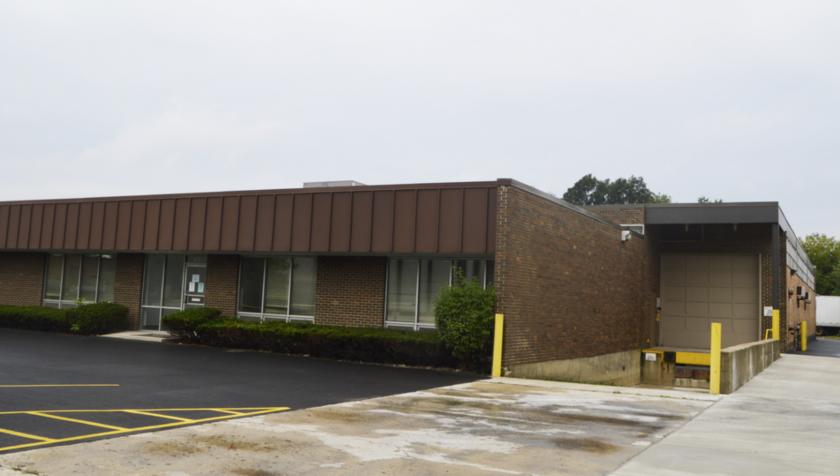
- • 1 exterior truck dock
- • 15 clear height
- • Two 1-ton cranes
- • Zoned I-1 Wheeling
- • 1 drive-in door 10 x 12
Listing Agents

Steve Sullivan
O: 847-610-0123
M: 847-610-0123
ssullivan@hiffman.com
O: 847-610-0123
M: 847-610-0123
ssullivan@hiffman.com

Sean Bostrom
O: 312-469-8406
sbostrom@equity.net
O: 312-469-8406
sbostrom@equity.net
While we strive to provide the most accurate information, all listing information, and demographic data, is provided by third-parties. As such, MyEListing will not be responsible for the accuracy of the information. It is strongly recommended that you verify all information with the listing agent, and any relevant agencies, prior to making any decisions.