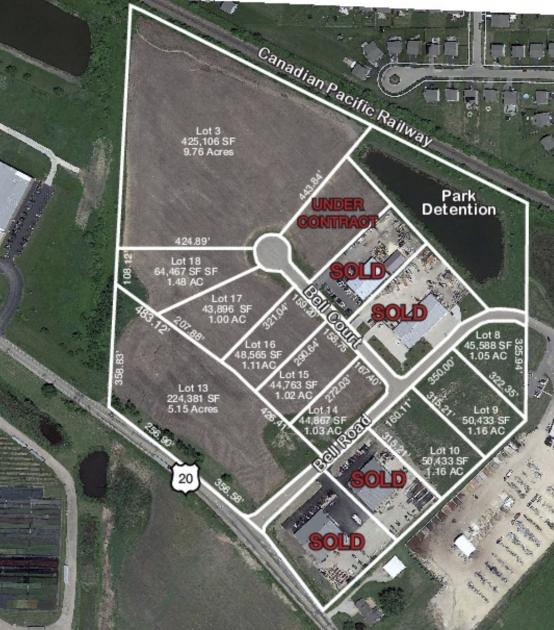
1-Mile | 3-Miles | 5-Miles | ||
---|---|---|---|---|
Total Population | 1,417 | 9,947 | 32,276 | |
Population Median Age | 35 | 35 | 39 | |
Population by Age | 0-9 Yrs | 238 (16%) | 1623 (16%) | 4600 (14%) |
10-19 Yrs | 203 (14%) | 1374 (13%) | 4083 (12%) | |
20-29 Yrs | 150 (10%) | 1079 (10%) | 3295 (10%) | |
30-39 Yrs | 228 (16%) | 1578 (15%) | 4614 (14%) | |
40-49 Yrs | 205 (14%) | 1390 (13%) | 4077 (12%) | |
50-59 Yrs | 206 (14%) | 1535 (15%) | 4796 (14%) | |
60-69 Yrs | 89 (6%) | 706 (7%) | 3366 (10%) | |
70+ Yrs | 97 (6%) | 662 (6%) | 3446 (10%) | |
Median HH Income | $101,264 | $105,878 | $98,664 | |
Total Household Income | < 24K | 42 (9%) | 265 (8%) | 1046 (9%) |
25-49K | 33 (7%) | 290 (8%) | 1525 (13%) | |
50-74K | 72 (15%) | 454 (13%) | 1668 (14%) | |
75-99K | 80 (17%) | 506 (15%) | 1558 (13%) | |
100-199K | 189 (40%) | 1384 (42%) | 4290 (37%) | |
200K+ | 46 (9%) | 370 (11%) | 1342 (11%) | |
Highest Education Level | No Diploma | 45 | 364 | 1275 |
Diploma or GED | 164 | 1160 | 4792 | |
Some College | 224 | 1543 | 5453 | |
Assoc. Degree | 72 | 541 | 1956 | |
Bachelors Degree | 308 | 2039 | 5924 | |
Higher Degree | 98 | 816 | 2765 | |
Total Housing Units | 477 | 3,431 | 12,042 | |
--Owner-Occupied | 404 | 2,856 | 10,094 | |
--Renter-Occupied | 58 | 412 | 1,335 | |
Owner-Occupied Values | < 100K | 4 | 39 | 248 |
100-199K | 98 | 666 | 2163 | |
200-299K | 151 | 999 | 3502 | |
300-399K | 94 | 708 | 2776 | |
400-499K | 32 | 264 | 940 | |
500K+ | 26 | 179 | 465 | |
Total Working Age Population | 1,021 | 7,283 | 24,572 | |
In Work Force | 723 | 5,132 | 16,274 | |
Not In Work Force | 298 | 2,151 | 8,298 | |
Workforce Employed | 710 | 5,025 | 15,698 | |
Workforce Unemployed | 12 | 108 | 574 | |
Civlian Workforce | 723 | 5,132 | 16,273 | |
Military Workforce | 0 | 0 | 2 | |
Total Households | 463 | 3,268 | 11,429 | |
Family Households | 374 | 2,645 | 8,667 | |
Non-Family Households | 89 | 623 | 2,761 | |
Married Couple | 328 | 2,326 | 7,569 | |
Other Family | 46 | 319 | 1,099 | |
Married w/Child | 188 | 1,265 | 3,429 | |
Single Male w/Child | 25 | 143 | 297 | |
Single Female w/Child | 10 | 56 | 236 |
Population Change Last Two Decades - Plus Projection
2000 | % | 2010 | % | 2020 | % | 2030 | |
---|---|---|---|---|---|---|---|
Illinois | 12,419,293 | +3 | 12,830,632 | +12 | 14,316,487 | +6 | 15,138,849 |
Kane County | 404,119 | +28 | 515,269 | +22 | 630,563 | +8 | 679,403 |
Total Working Age Population:
Total Households:
Total Working Age Population:
Total Households:
Total Working Age Population:
Total Households: