Retail Space
542 Berlin - Cross Keys Road Sicklerville, NJ 08081
542 Berlin - Cross Keys Road Sicklerville, NJ 08081
Details & Description
Property Highlights
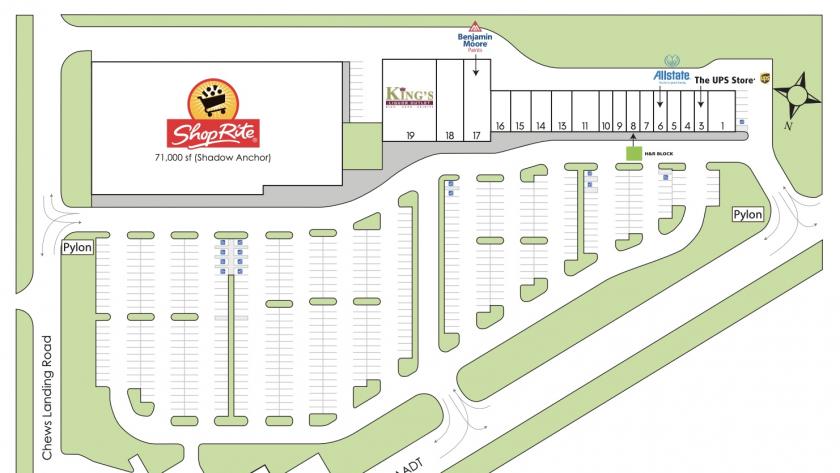
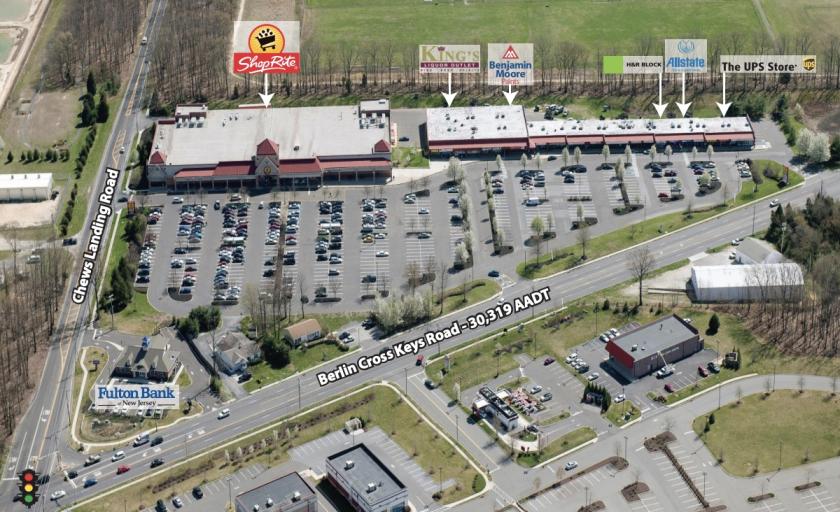
• The center has excellent visibility and access from both Berlin Cross Keys Road and Chews Landing Road.
• Winslow Plaza is shadow-anchored by a high-volume ShopRite, which brings high traffic to the center.
Listing Agents

Raymond Hicks
O: 757-627-9088
M: 757-434-1168
rhicks@whlr.us
O: 757-627-9088
M: 757-434-1168
rhicks@whlr.us
While we strive to provide the most accurate information, all listing information, and demographic data, is provided by third-parties. As such, MyEListing will not be responsible for the accuracy of the information. It is strongly recommended that you verify all information with the listing agent, and any relevant agencies, prior to making any decisions.