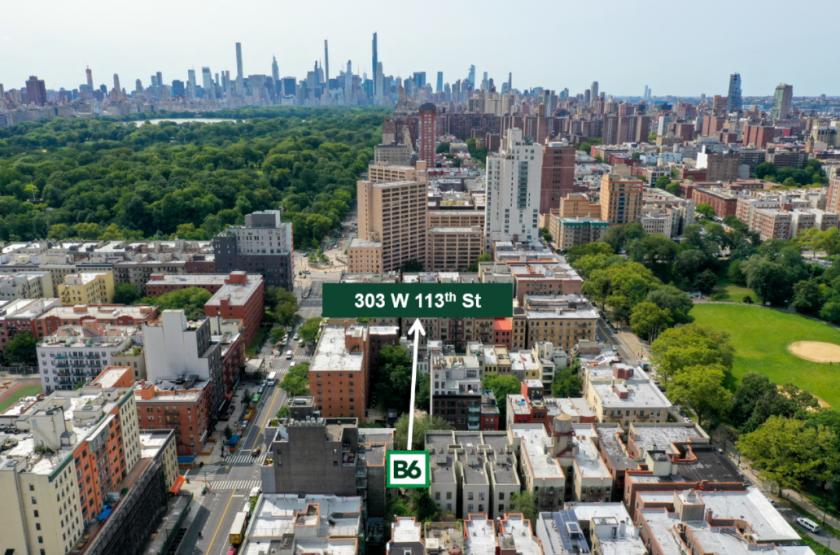
Approximately 13,500 BSF site located within just a few blocks from Central Park
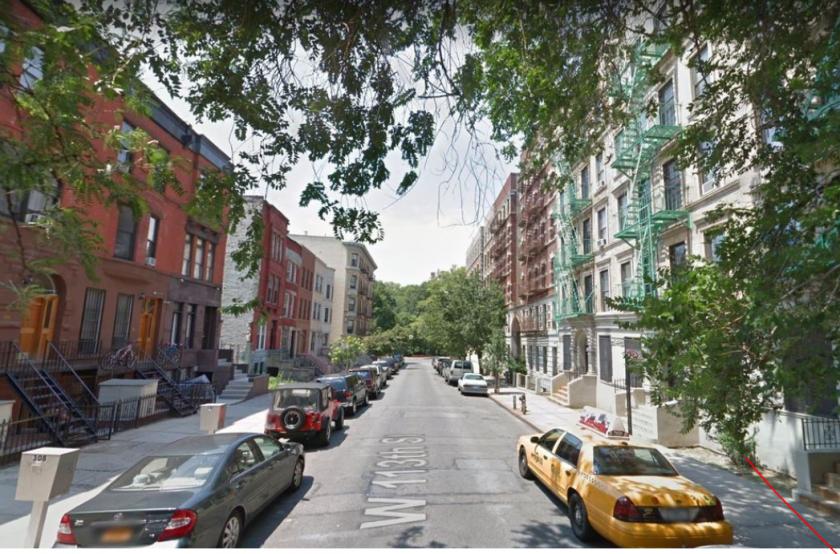
Ideally located on residential block, offering opportunity to build walk-up apartments
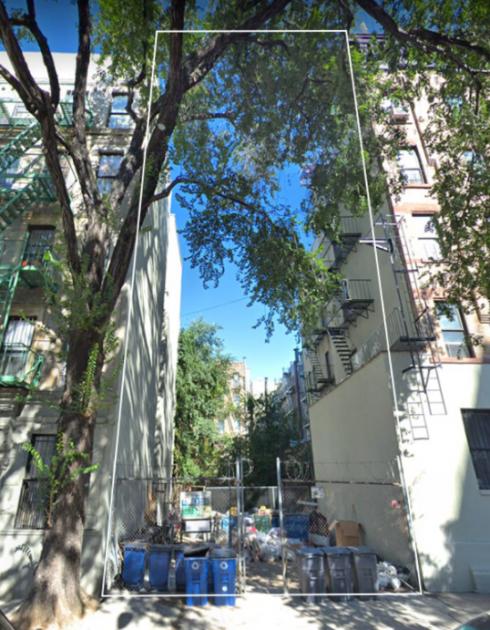
Features a 2,523 SF lot area with R7A zoning allowing for a residential FAR of 4.00, which translates to 13,500 BSF when combined with the additional air rights from neighboring parcel included with sale
Strong residential demand drivers created by proximity to Central Park (three blocks away) and Morningside Park (one block away)
Located one-half (0.5) mile walk from Columbia University, presenting a prime development opportunity for student or faculty accommodation
No part of this information may be copied, reproduced, repurposed, or screen-captured for any commercial purpose without prior written authorization from MyEListing.
While we strive to provide the most accurate information, all listing information, and demographic data, is provided by third-parties. As such, MyEListing will not be responsible for the accuracy of the information. It is strongly recommended that you verify all information with the listing agent, and any relevant agencies, prior to making any decisions.
What is the asking price for 303 West 113th Street in New York?
The asking price for 303 West 113th Street is $2,950,000
How much land does the New York, NY property at 303 West 113th Street include?
303 West 113th Street in New York includes 0.232 acres of land
What kind of Land is the propery at 303 West 113th Street?
The property at 303 West 113th Street New York, NY 10026 is listed as a Mixed Use Land Land property
What is the population within 1 mile of 303 West 113th Street in New York?
The population within 1 mile of 303 West 113th Street New York, NY 10026 is 220,646 people.
Who do I contact for questions about 303 West 113th Street?
You should contact the listing agent,
Brian Whelan, for any details regarding this commercial listing.