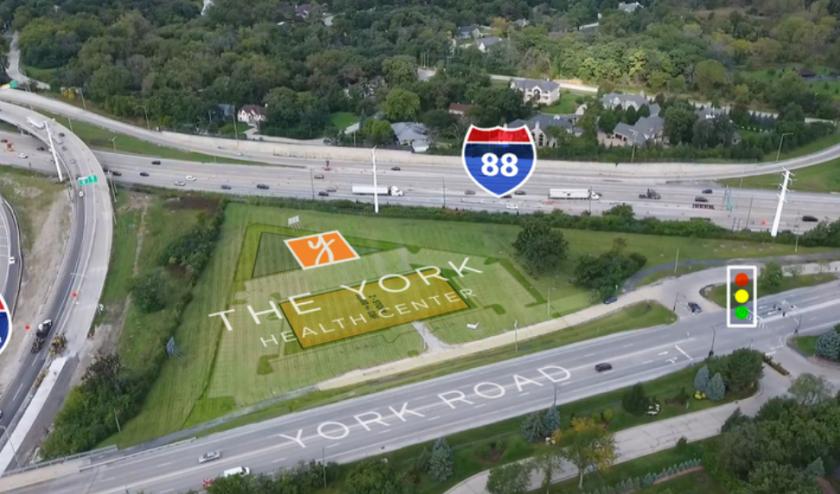
1-Mile | 3-Miles | 5-Miles | ||
---|---|---|---|---|
Total Population | 4,964 | 85,483 | 320,036 | |
Population Median Age | 47 | 41 | 39 | |
Population by Age | 0-9 Yrs | 497 (10%) | 10672 (12%) | 41888 (13%) |
10-19 Yrs | 484 (9%) | 10102 (11%) | 43818 (13%) | |
20-29 Yrs | 435 (8%) | 9564 (11%) | 35501 (11%) | |
30-39 Yrs | 497 (10%) | 9896 (11%) | 39780 (12%) | |
40-49 Yrs | 545 (10%) | 11008 (12%) | 42534 (13%) | |
50-59 Yrs | 730 (14%) | 12423 (14%) | 45494 (14%) | |
60-69 Yrs | 646 (13%) | 10192 (11%) | 35295 (11%) | |
70+ Yrs | 1130 (22%) | 11627 (13%) | 35728 (11%) | |
Median HH Income | $93,633 | $91,428 | $85,938 | |
Total Household Income | < 24K | 257 (11%) | 3660 (11%) | 14791 (12%) |
25-49K | 306 (14%) | 5016 (15%) | 19209 (16%) | |
50-74K | 329 (15%) | 4454 (14%) | 16329 (14%) | |
75-99K | 252 (11%) | 4031 (12%) | 15287 (13%) | |
100-199K | 681 (31%) | 9142 (28%) | 31088 (27%) | |
200K+ | 334 (15%) | 5255 (16%) | 17331 (15%) | |
Highest Education Level | No Diploma | 136 | 4095 | 19524 |
Diploma or GED | 632 | 11694 | 46443 | |
Some College | 689 | 11260 | 40278 | |
Assoc. Degree | 270 | 3692 | 14863 | |
Bachelors Degree | 1111 | 16781 | 56141 | |
Higher Degree | 900 | 12004 | 39434 | |
Total Housing Units | 2,331 | 33,829 | 122,086 | |
--Owner-Occupied | 1,689 | 24,991 | 86,542 | |
--Renter-Occupied | 470 | 6,568 | 27,492 | |
Owner-Occupied Values | < 100K | 18 | 1253 | 5094 |
100-199K | 209 | 4646 | 18048 | |
200-299K | 375 | 6188 | 22544 | |
300-399K | 242 | 3976 | 13151 | |
400-499K | 211 | 2507 | 7167 | |
500K+ | 635 | 6421 | 20538 | |
Total Working Age Population | 4,152 | 68,452 | 250,974 | |
In Work Force | 2,305 | 44,013 | 164,207 | |
Not In Work Force | 1,847 | 24,439 | 86,768 | |
Workforce Employed | 2,171 | 41,836 | 156,186 | |
Workforce Unemployed | 134 | 2,177 | 8,008 | |
Civlian Workforce | 2,305 | 44,013 | 164,195 | |
Military Workforce | 0 | 0 | 12 | |
Total Households | 2,158 | 31,559 | 114,034 | |
Family Households | 1,296 | 21,494 | 79,748 | |
Non-Family Households | 862 | 10,065 | 34,286 | |
Married Couple | 1,113 | 17,436 | 61,516 | |
Other Family | 183 | 4,058 | 18,232 | |
Married w/Child | 399 | 7,200 | 27,418 | |
Single Male w/Child | 14 | 312 | 2,098 | |
Single Female w/Child | 28 | 1,064 | 5,635 |
Population Change Last Two Decades - Plus Projection
2000 | % | 2010 | % | 2020 | % | 2030 | |
---|---|---|---|---|---|---|---|
Illinois | 12,419,293 | +3 | 12,830,632 | +12 | 14,316,487 | +6 | 15,138,849 |
Cook County | 5,376,741 | -3 | 5,194,675 | +10 | 5,707,832 | +5 | 5,990,243 |
DuPage County | 904,161 | +1 | 916,924 | +10 | 1,010,323 | +2 | 1,034,039 |
Total Working Age Population:
Total Households:
Total Working Age Population:
Total Households:
Total Working Age Population:
Total Households: