Commercial Land
Higgins Rd. Beverly Road Hoffman Estates, IL 60169
Higgins Rd. Beverly Road Hoffman Estates, IL 60169
Details & Description
Property Highlights
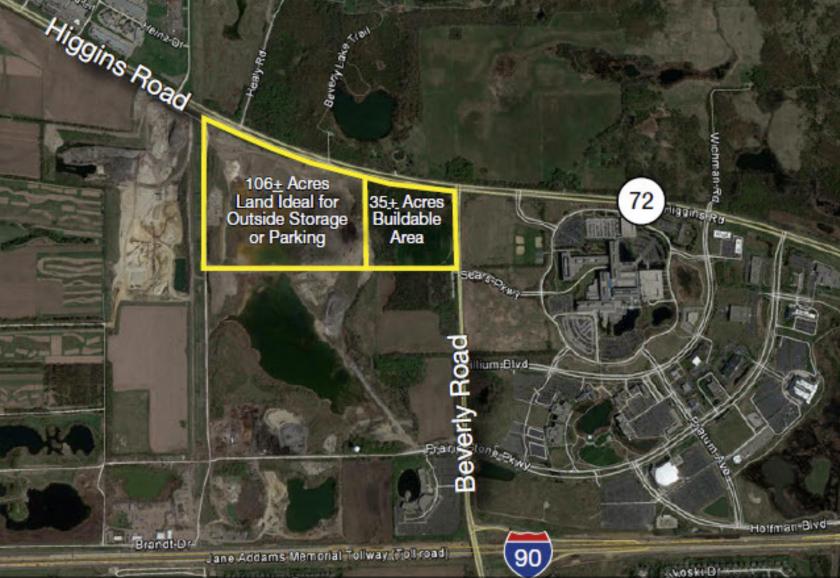
- • Ideal for outside storage or parking
- • Infill site
- • Expressway frontage
- • 35 acres buildable
- • Retail visibility
- • Ready for immediate development
Listing Agents

David Haigh
O: 630-693-0649
M: 630-525-0649
dhaigh@hiffman.com
O: 630-693-0649
M: 630-525-0649
dhaigh@hiffman.com

John Cash
NAI Hiffman
O: 630-691-0609
M: 847-764-5558
jcash@hiffman.com
NAI Hiffman
O: 630-691-0609
M: 847-764-5558
jcash@hiffman.com
While we strive to provide the most accurate information, all listing information, and demographic data, is provided by third-parties. As such, MyEListing will not be responsible for the accuracy of the information. It is strongly recommended that you verify all information with the listing agent, and any relevant agencies, prior to making any decisions.