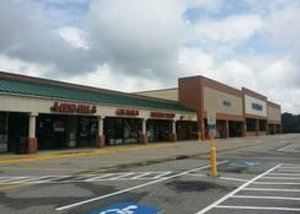
1-Mile | 3-Miles | 5-Miles | ||
---|---|---|---|---|
Total Population | 1,960 | 6,352 | 9,974 | |
Population Median Age | 35 | 39 | 41 | |
Population by Age | 0-9 Yrs | 270 (13%) | 649 (10%) | 1005 (10%) |
10-19 Yrs | 364 (18%) | 922 (14%) | 1369 (13%) | |
20-29 Yrs | 311 (15%) | 1209 (19%) | 1672 (16%) | |
30-39 Yrs | 248 (12%) | 631 (9%) | 946 (9%) | |
40-49 Yrs | 154 (7%) | 462 (7%) | 839 (8%) | |
50-59 Yrs | 221 (11%) | 925 (14%) | 1349 (13%) | |
60-69 Yrs | 241 (12%) | 891 (14%) | 1613 (16%) | |
70+ Yrs | 151 (7%) | 663 (10%) | 1180 (11%) | |
Median HH Income | $30,652 | $32,926 | $32,526 | |
Total Household Income | < 24K | 289 (44%) | 911 (42%) | 1484 (40%) |
25-49K | 165 (25%) | 501 (23%) | 931 (25%) | |
50-74K | 130 (20%) | 387 (18%) | 609 (16%) | |
75-99K | 42 (6%) | 261 (12%) | 425 (11%) | |
100-199K | 15 (2%) | 73 (3%) | 168 (4%) | |
200K+ | 3 (0%) | 17 (0%) | 26 (0%) | |
Highest Education Level | No Diploma | 337 | 1125 | 1719 |
Diploma or GED | 435 | 1531 | 2481 | |
Some College | 144 | 593 | 1083 | |
Assoc. Degree | 70 | 324 | 508 | |
Bachelors Degree | 122 | 474 | 675 | |
Higher Degree | 43 | 190 | 367 | |
Total Housing Units | 886 | 2,761 | 4,648 | |
--Owner-Occupied | 288 | 1,383 | 2,452 | |
--Renter-Occupied | 357 | 767 | 1,191 | |
Owner-Occupied Values | < 100K | 211 | 1022 | 1689 |
100-199K | 36 | 244 | 494 | |
200-299K | 3 | 48 | 155 | |
300-399K | 38 | 63 | 82 | |
400-499K | 0 | 2 | 12 | |
500K+ | 0 | 4 | 20 | |
Total Working Age Population | 1,517 | 5,248 | 8,204 | |
In Work Force | 822 | 2,786 | 4,186 | |
Not In Work Force | 695 | 2,462 | 4,018 | |
Workforce Employed | 774 | 2,604 | 3,883 | |
Workforce Unemployed | 47 | 183 | 304 | |
Civlian Workforce | 822 | 2,786 | 4,186 | |
Military Workforce | 0 | 0 | 0 | |
Total Households | 644 | 2,150 | 3,643 | |
Family Households | 407 | 1,344 | 2,268 | |
Non-Family Households | 237 | 806 | 1,375 | |
Married Couple | 140 | 633 | 1,242 | |
Other Family | 266 | 711 | 1,025 | |
Married w/Child | 76 | 255 | 447 | |
Single Male w/Child | 11 | 56 | 73 | |
Single Female w/Child | 111 | 191 | 298 |
Population Change Last Two Decades - Plus Projection
2000 | % | 2010 | % | 2020 | % | 2030 | |
---|---|---|---|---|---|---|---|
South Carolina | 4,012,012 | +15 | 4,625,364 | +9 | 5,020,400 | +9 | 5,488,460 |
Dillon County | 30,722 | +4 | 32,062 | -4 | 30,860 | 0 | 31,000 |
Florence County | 125,761 | +9 | 136,885 | +5 | 143,230 | +6 | 151,940 |
Horry County | 196,629 | +37 | 269,291 | +18 | 316,810 | +16 | 367,680 |
Marion County | 35,466 | -7 | 33,062 | +6 | 35,020 | +2 | 35,680 |
Total Working Age Population:
Total Households:
Total Working Age Population:
Total Households:
Total Working Age Population:
Total Households: