Industrial Properties
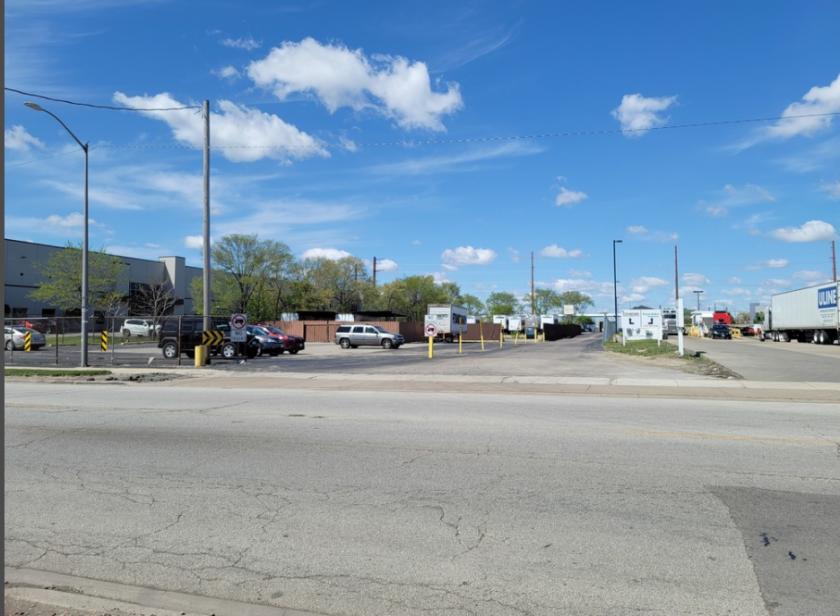
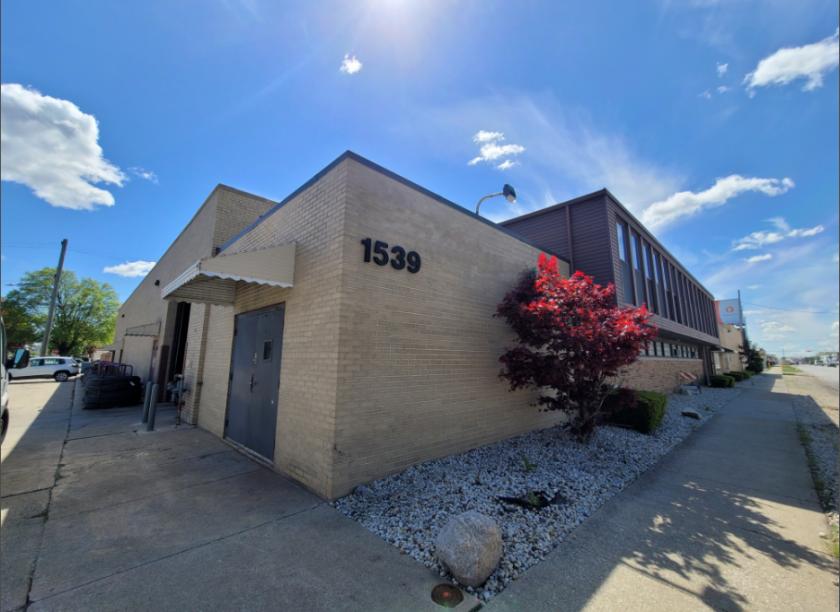
1539 25th Avenue Melrose Park, IL 60160
1539 25th Avenue Melrose Park, IL 60160
Details & Description
Property Highlights
- • Clear height 14
- • Sprinklered No
- • Year built 1947 4 additions since then
- • Building acres 0.70
- • Drive-ins 3
- • Power 1,200A, 277480V, 3-phase
Listing Agents

Joe Bronson
O: 630-317-0725
M: 708-308-1155
jbronson@hiffman.com
O: 630-317-0725
M: 708-308-1155
jbronson@hiffman.com

Josh Will
NAI Hiffman
O: 630-317-0794
M: 630-317-0794
jwill@hiffman.com
NAI Hiffman
O: 630-317-0794
M: 630-317-0794
jwill@hiffman.com

Aimee Goudas
HAI Hiffman
O: 630-317-0714
M: 617-939-7944
agoudas@hiffman.com
HAI Hiffman
O: 630-317-0714
M: 617-939-7944
agoudas@hiffman.com
While we strive to provide the most accurate information, all listing information, and demographic data, is provided by third-parties. As such, MyEListing will not be responsible for the accuracy of the information. It is strongly recommended that you verify all information with the listing agent, and any relevant agencies, prior to making any decisions.