Commercial Land
101 Lark Drive Moyock, NC 27958
101 Lark Drive Moyock, NC 27958
Details & Description
Property Highlights
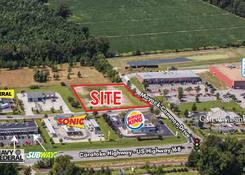
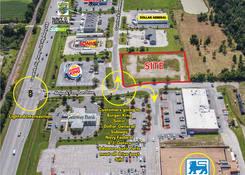
• US Highway 168 is the major thoroughfare from the north when going to the Outer Banks of North Carolina.
• 19,000 AADT on US Highway 168. 32,000 AADT during peak summer months.
Listing Agents

Angelica Beltran
O: 757-627-9088
M: 757-621-8682
angelica@whlr.us
O: 757-627-9088
M: 757-621-8682
angelica@whlr.us
While we strive to provide the most accurate information, all listing information, and demographic data, is provided by third-parties. As such, MyEListing will not be responsible for the accuracy of the information. It is strongly recommended that you verify all information with the listing agent, and any relevant agencies, prior to making any decisions.