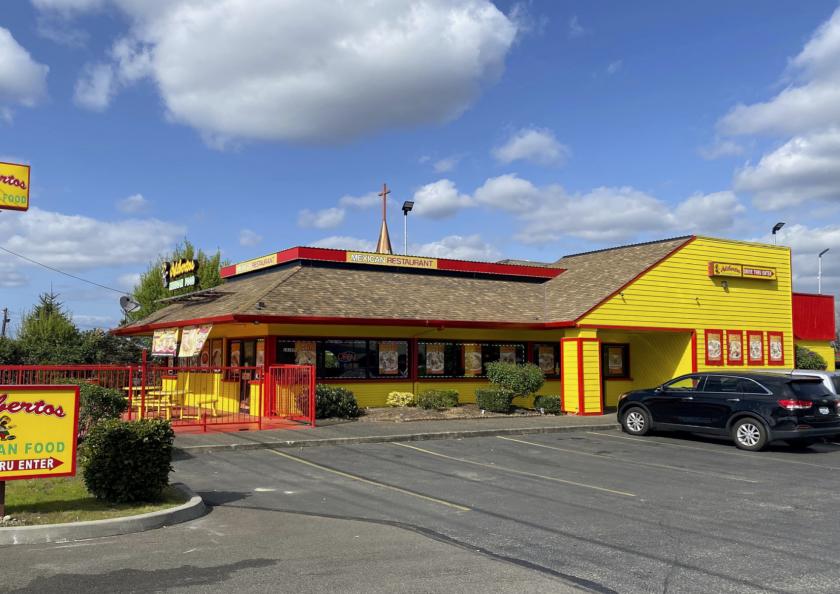
1-Mile | 3-Miles | 5-Miles | ||
---|---|---|---|---|
Total Population | 13,974 | 103,943 | 254,953 | |
Population Median Age | 33 | 36 | 37 | |
Population by Age | 0-9 Yrs | 2539 (18%) | 15051 (14%) | 35369 (13%) |
10-19 Yrs | 1423 (10%) | 12342 (11%) | 29472 (11%) | |
20-29 Yrs | 2819 (20%) | 18943 (18%) | 45238 (17%) | |
30-39 Yrs | 2347 (16%) | 15971 (15%) | 36753 (14%) | |
40-49 Yrs | 1631 (11%) | 11439 (11%) | 29681 (11%) | |
50-59 Yrs | 1221 (8%) | 11918 (11%) | 30317 (11%) | |
60-69 Yrs | 1247 (8%) | 10377 (9%) | 26600 (10%) | |
70+ Yrs | 747 (5%) | 7902 (7%) | 21523 (8%) | |
Median HH Income | $42,317 | $50,274 | $56,940 | |
Total Household Income | < 24K | 1444 (27%) | 9015 (22%) | 18194 (18%) |
25-49K | 1692 (31%) | 10745 (27%) | 23563 (24%) | |
50-74K | 1014 (19%) | 8482 (21%) | 20108 (20%) | |
75-99K | 688 (12%) | 4616 (11%) | 13116 (13%) | |
100-199K | 410 (7%) | 6020 (15%) | 17783 (18%) | |
200K+ | 62 (1%) | 856 (2%) | 3335 (3%) | |
Highest Education Level | No Diploma | 1742 | 10056 | 20620 |
Diploma or GED | 2843 | 20630 | 49986 | |
Some College | 2124 | 17063 | 43326 | |
Assoc. Degree | 648 | 6762 | 18804 | |
Bachelors Degree | 856 | 9233 | 25554 | |
Higher Degree | 276 | 3393 | 11055 | |
Total Housing Units | 5,804 | 42,632 | 103,428 | |
--Owner-Occupied | 1,206 | 16,802 | 47,780 | |
--Renter-Occupied | 4,104 | 22,931 | 48,320 | |
Owner-Occupied Values | < 100K | 301 | 1303 | 3196 |
100-199K | 421 | 4822 | 11922 | |
200-299K | 404 | 6601 | 17179 | |
300-399K | 65 | 2539 | 9283 | |
400-499K | 0 | 519 | 3109 | |
500K+ | 14 | 1019 | 3091 | |
Total Working Age Population | 10,445 | 81,672 | 202,106 | |
In Work Force | 6,844 | 52,306 | 129,638 | |
Not In Work Force | 3,601 | 29,366 | 72,468 | |
Workforce Employed | 6,211 | 47,111 | 117,342 | |
Workforce Unemployed | 403 | 3,239 | 7,063 | |
Civlian Workforce | 6,615 | 50,350 | 124,405 | |
Military Workforce | 229 | 1,956 | 5,233 | |
Total Households | 5,310 | 39,733 | 96,100 | |
Family Households | 3,260 | 24,863 | 60,844 | |
Non-Family Households | 2,050 | 14,870 | 35,256 | |
Married Couple | 1,912 | 15,886 | 40,998 | |
Other Family | 1,349 | 8,977 | 19,846 | |
Married w/Child | 931 | 6,524 | 16,432 | |
Single Male w/Child | 220 | 1,339 | 2,929 | |
Single Female w/Child | 666 | 4,020 | 8,148 |
Population Change Last Two Decades - Plus Projection
2000 | % | 2010 | % | 2020 | % | 2030 | |
---|---|---|---|---|---|---|---|
Washington | 5,894,121 | +14 | 6,724,540 | +14 | 7,638,415 | +11 | 8,503,178 |
King County | 1,737,034 | +11 | 1,931,249 | +16 | 2,231,408 | +11 | 2,474,625 |
Pierce County | 700,820 | +13 | 795,225 | +13 | 901,251 | +11 | 1,002,412 |
Thurston County | 207,355 | +22 | 252,264 | +17 | 294,333 | +14 | 335,965 |
Total Working Age Population:
Total Households:
Total Working Age Population:
Total Households:
Total Working Age Population:
Total Households: