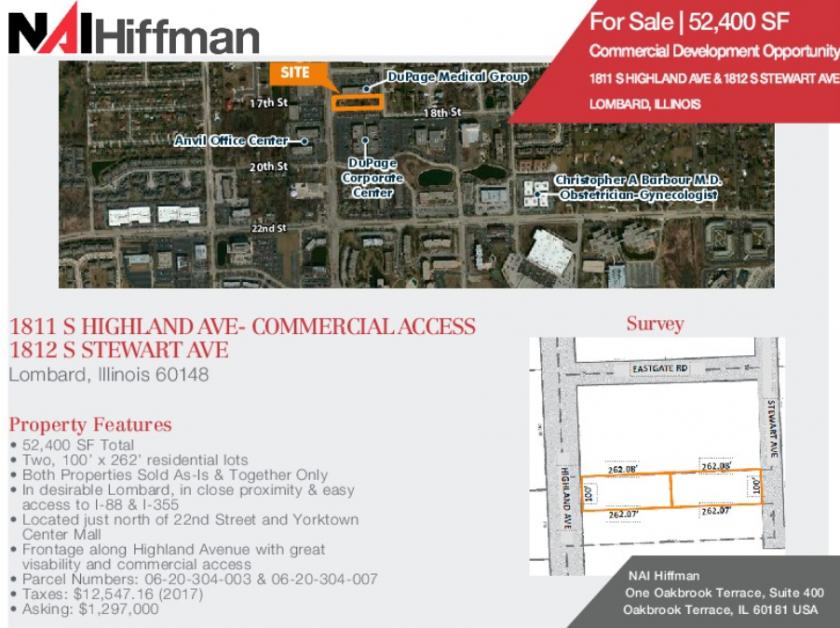
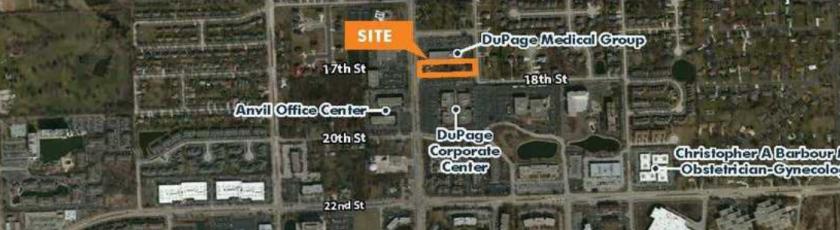
1-Mile | 3-Miles | 5-Miles | ||
---|---|---|---|---|
Total Population | 11,583 | 92,928 | 265,798 | |
Population Median Age | 41 | 40 | 39 | |
Population by Age | 0-9 Yrs | 1161 (10%) | 10995 (11%) | 33828 (12%) |
10-19 Yrs | 1079 (9%) | 11000 (11%) | 35488 (13%) | |
20-29 Yrs | 2102 (18%) | 12244 (13%) | 31734 (11%) | |
30-39 Yrs | 1738 (15%) | 12043 (12%) | 32875 (12%) | |
40-49 Yrs | 981 (8%) | 11029 (11%) | 33037 (12%) | |
50-59 Yrs | 1447 (12%) | 12721 (13%) | 37521 (14%) | |
60-69 Yrs | 1152 (9%) | 10810 (11%) | 30953 (11%) | |
70+ Yrs | 1922 (16%) | 12087 (13%) | 30363 (11%) | |
Median HH Income | $71,630 | $87,187 | $92,262 | |
Total Household Income | < 24K | 824 (15%) | 4299 (11%) | 11983 (11%) |
25-49K | 1209 (22%) | 5809 (15%) | 15150 (15%) | |
50-74K | 740 (13%) | 5663 (15%) | 14609 (14%) | |
75-99K | 687 (12%) | 5042 (13%) | 12553 (12%) | |
100-199K | 1583 (29%) | 10994 (30%) | 29803 (29%) | |
200K+ | 339 (6%) | 4651 (12%) | 16723 (16%) | |
Highest Education Level | No Diploma | 311 | 3036 | 9267 |
Diploma or GED | 1493 | 11609 | 29724 | |
Some College | 1490 | 12190 | 31535 | |
Assoc. Degree | 467 | 4350 | 12045 | |
Bachelors Degree | 2868 | 20715 | 58204 | |
Higher Degree | 1841 | 13093 | 39721 | |
Total Housing Units | 5,711 | 38,813 | 106,592 | |
--Owner-Occupied | 3,283 | 26,467 | 74,856 | |
--Renter-Occupied | 2,098 | 9,991 | 25,964 | |
Owner-Occupied Values | < 100K | 336 | 1424 | 3346 |
100-199K | 644 | 3645 | 8692 | |
200-299K | 1300 | 8385 | 20436 | |
300-399K | 609 | 5808 | 15627 | |
400-499K | 135 | 2440 | 8440 | |
500K+ | 259 | 4766 | 18315 | |
Total Working Age Population | 9,939 | 75,263 | 210,927 | |
In Work Force | 6,256 | 49,414 | 140,206 | |
Not In Work Force | 3,683 | 25,848 | 70,721 | |
Workforce Employed | 6,143 | 47,652 | 134,950 | |
Workforce Unemployed | 113 | 1,757 | 5,239 | |
Civlian Workforce | 6,256 | 49,408 | 140,189 | |
Military Workforce | 0 | 6 | 17 | |
Total Households | 5,381 | 36,458 | 100,821 | |
Family Households | 2,782 | 24,112 | 67,998 | |
Non-Family Households | 2,599 | 12,346 | 32,823 | |
Married Couple | 2,231 | 19,420 | 56,467 | |
Other Family | 552 | 4,692 | 11,531 | |
Married w/Child | 752 | 7,725 | 24,739 | |
Single Male w/Child | 20 | 446 | 1,350 | |
Single Female w/Child | 188 | 1,532 | 3,948 |
Population Change Last Two Decades - Plus Projection
2000 | % | 2010 | % | 2020 | % | 2030 | |
---|---|---|---|---|---|---|---|
Illinois | 12,419,293 | +3 | 12,830,632 | +12 | 14,316,487 | +6 | 15,138,849 |
Cook County | 5,376,741 | -3 | 5,194,675 | +10 | 5,707,832 | +5 | 5,990,243 |
DuPage County | 904,161 | +1 | 916,924 | +10 | 1,010,323 | +2 | 1,034,039 |
Total Working Age Population:
Total Households:
Total Working Age Population:
Total Households:
Total Working Age Population:
Total Households: