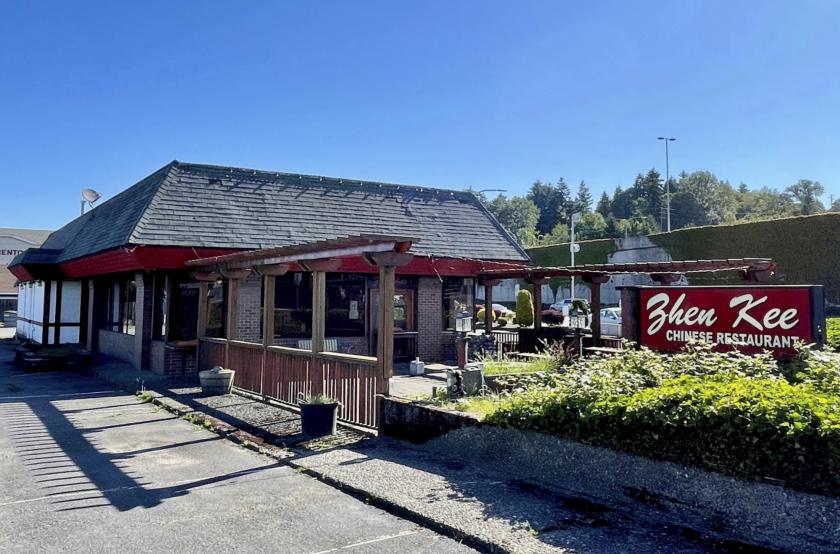
Retail Space
151 Sunset Boulevard North Renton, WA 98057
151 Sunset Boulevard North Renton, WA 98057
Details & Description
Property Highlights
- • 32 parking spaces at a 10.771,000 SF ratio
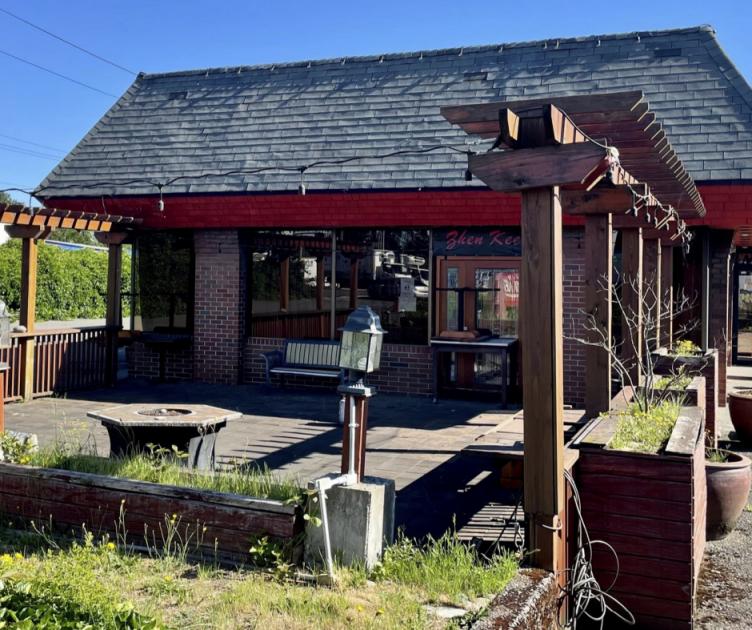
- • Outside patio area
- • Instant access to I-405
- • 157 frontage on Sunset Blvd
- • Current tenant to vacate upon sale
Listing Agents

Jeff Crane
O: 206-336-5336
jcrane@andoverco.com
O: 206-336-5336
jcrane@andoverco.com

Veronika Zwicke
The Andover Company Inc.
O: 206-336-5335
vzwicke@andoverco.com
The Andover Company Inc.
O: 206-336-5335
vzwicke@andoverco.com
While we strive to provide the most accurate information, all listing information, and demographic data, is provided by third-parties. As such, MyEListing will not be responsible for the accuracy of the information. It is strongly recommended that you verify all information with the listing agent, and any relevant agencies, prior to making any decisions.