Specialty Real Estate
2401 North Northlake Way Seattle, WA 98103
2401 North Northlake Way Seattle, WA 98103
Details & Description
Property Highlights
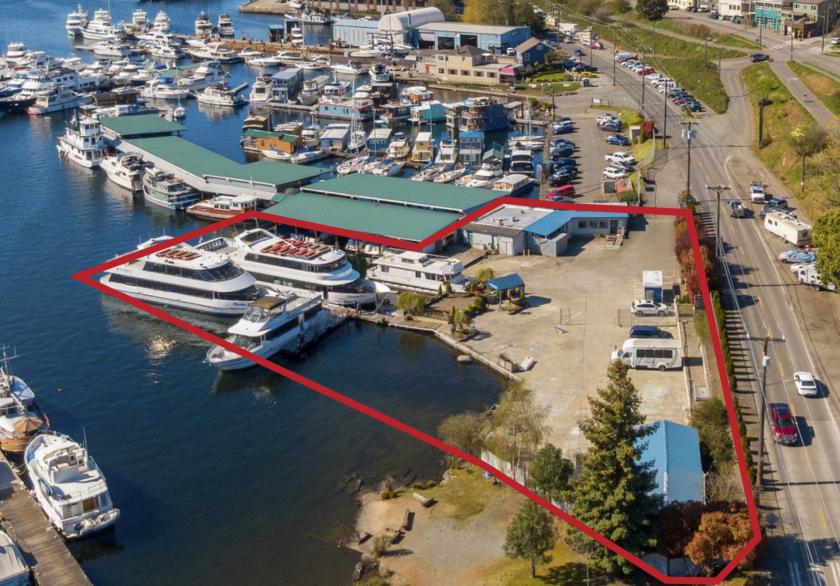
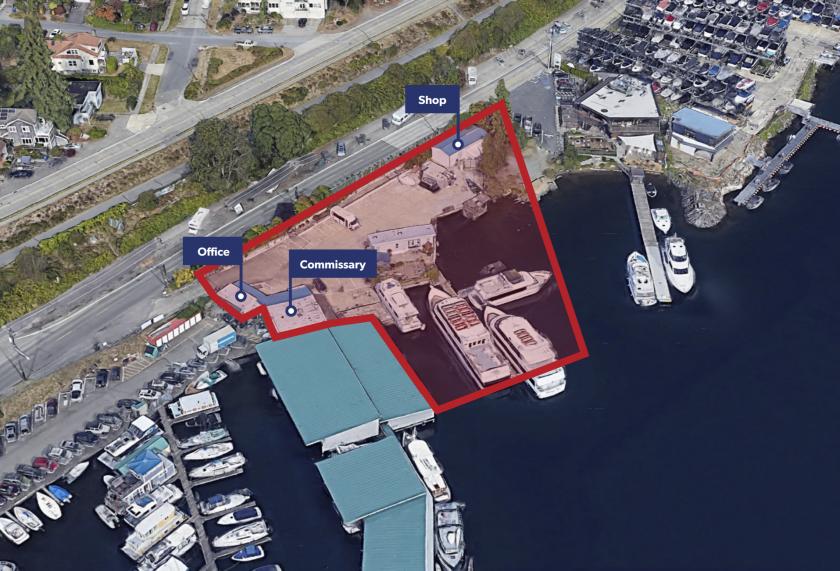
- • 25,000 SF secure parking lot with 30 spaces
- • 1,900 SF office with commercial kitchen
- • 1,000 SF workshopbarn
Listing Agents

Bruce Clarkson
O: 206-336-5332
bclarkson@andoverco.com
O: 206-336-5332
bclarkson@andoverco.com

Veronika Zwicke
The Andover Company Inc.
O: 206-336-5335
vzwicke@andoverco.com
The Andover Company Inc.
O: 206-336-5335
vzwicke@andoverco.com
While we strive to provide the most accurate information, all listing information, and demographic data, is provided by third-parties. As such, MyEListing will not be responsible for the accuracy of the information. It is strongly recommended that you verify all information with the listing agent, and any relevant agencies, prior to making any decisions.