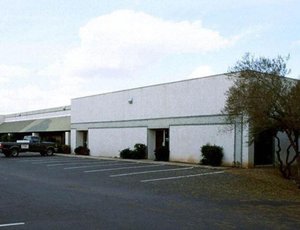
1-Mile | 3-Miles | 5-Miles | ||
---|---|---|---|---|
Total Population | 5,799 | 87,627 | 226,029 | |
Population Median Age | 43 | 45 | 42 | |
Population by Age | 0-9 Yrs | 690 (11%) | 9404 (10%) | 27275 (12%) |
10-19 Yrs | 637 (10%) | 10179 (11%) | 27535 (12%) | |
20-29 Yrs | 666 (11%) | 9365 (10%) | 27509 (12%) | |
30-39 Yrs | 603 (10%) | 7990 (9%) | 24576 (10%) | |
40-49 Yrs | 533 (9%) | 9252 (10%) | 24976 (11%) | |
50-59 Yrs | 944 (16%) | 11722 (13%) | 28729 (12%) | |
60-69 Yrs | 845 (14%) | 12425 (14%) | 28169 (12%) | |
70+ Yrs | 881 (15%) | 17290 (19%) | 37261 (16%) | |
Median HH Income | $77,047 | $59,628 | $61,028 | |
Total Household Income | < 24K | 401 (18%) | 6673 (19%) | 14487 (16%) |
25-49K | 291 (13%) | 7698 (21%) | 19900 (23%) | |
50-74K | 364 (16%) | 6985 (19%) | 16882 (19%) | |
75-99K | 406 (18%) | 4259 (12%) | 10648 (12%) | |
100-199K | 494 (22%) | 7155 (20%) | 18260 (21%) | |
200K+ | 222 (10%) | 2307 (6%) | 5073 (5%) | |
Highest Education Level | No Diploma | 412 | 4841 | 13588 |
Diploma or GED | 915 | 16500 | 40269 | |
Some College | 1204 | 18513 | 45732 | |
Assoc. Degree | 350 | 5435 | 14423 | |
Bachelors Degree | 956 | 12175 | 29670 | |
Higher Degree | 388 | 6522 | 15460 | |
Total Housing Units | 2,538 | 43,538 | 103,049 | |
--Owner-Occupied | 1,627 | 25,665 | 58,945 | |
--Renter-Occupied | 552 | 9,410 | 26,305 | |
Owner-Occupied Values | < 100K | 116 | 5698 | 10810 |
100-199K | 365 | 5769 | 13827 | |
200-299K | 667 | 7156 | 17307 | |
300-399K | 183 | 3311 | 8304 | |
400-499K | 85 | 1492 | 3890 | |
500K+ | 211 | 2239 | 4806 | |
Total Working Age Population | 4,673 | 71,966 | 182,243 | |
In Work Force | 2,801 | 39,775 | 106,158 | |
Not In Work Force | 1,872 | 32,191 | 76,085 | |
Workforce Employed | 2,658 | 37,754 | 100,836 | |
Workforce Unemployed | 140 | 2,007 | 5,265 | |
Civlian Workforce | 2,797 | 39,761 | 106,102 | |
Military Workforce | 4 | 14 | 57 | |
Total Households | 2,179 | 35,076 | 85,250 | |
Family Households | 1,518 | 22,508 | 56,291 | |
Non-Family Households | 661 | 12,568 | 28,959 | |
Married Couple | 1,273 | 18,092 | 43,687 | |
Other Family | 245 | 4,416 | 12,604 | |
Married w/Child | 376 | 5,225 | 14,377 | |
Single Male w/Child | 39 | 734 | 1,875 | |
Single Female w/Child | 93 | 1,263 | 3,970 |
Population Change Last Two Decades - Plus Projection
2000 | % | 2010 | % | 2020 | % | 2030 | |
---|---|---|---|---|---|---|---|
Arizona | 5,130,632 | +25 | 6,392,017 | +14 | 7,286,100 | +14 | 8,284,900 |
Gila County | 51,335 | +4 | 53,597 | +3 | 55,100 | +1 | 55,400 |
Maricopa County | 3,072,149 | +24 | 3,817,117 | +16 | 4,436,900 | +15 | 5,107,700 |
Pinal County | 179,727 | +109 | 375,770 | +24 | 466,200 | +32 | 616,200 |
Total Working Age Population:
Total Households:
Total Working Age Population:
Total Households:
Total Working Age Population:
Total Households: