Office Space
331 Oak Manor Drive Glen Burnie, MD 21061
331 Oak Manor Drive Glen Burnie, MD 21061
Details & Description
Property Highlights
- • Located Just off Route 100 and Route 97
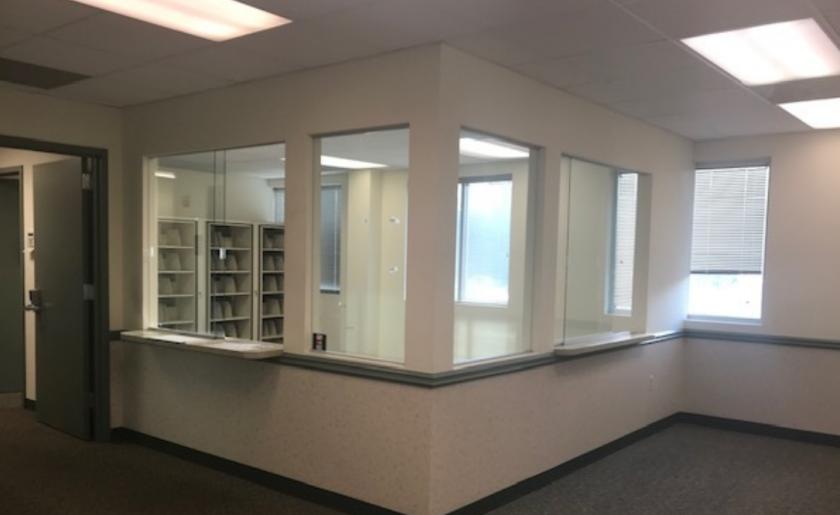
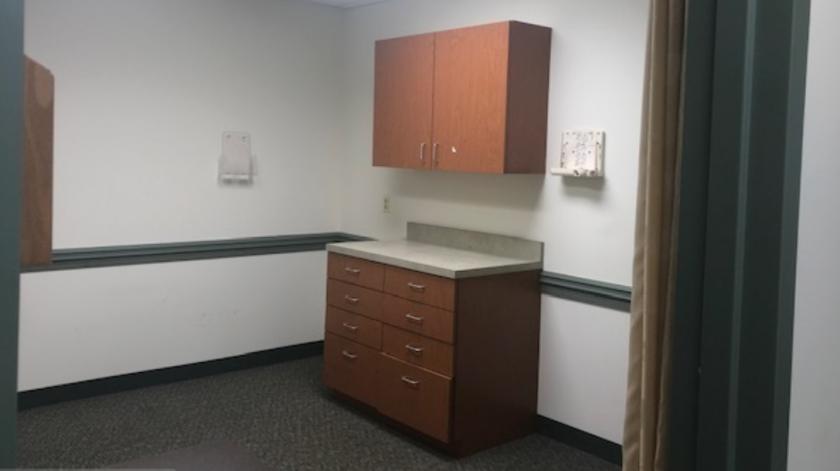
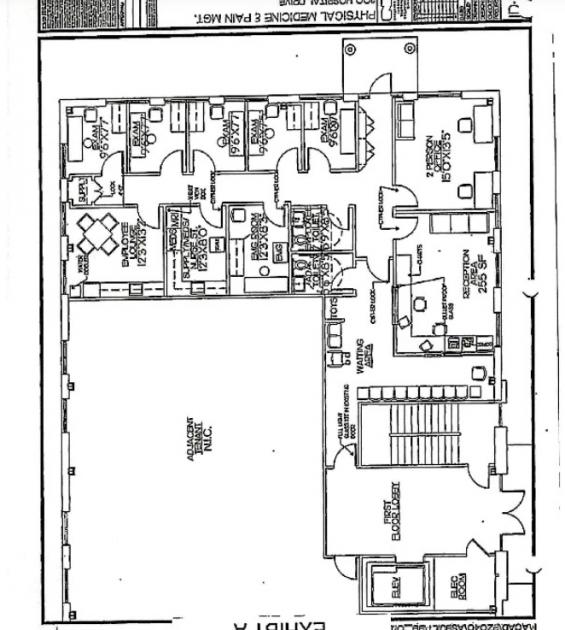
- • Turn Key First Floor Suite
- • 7 Treatment rooms
- • Pylon Signage
- • Less than 1 Mile from UM BW Medical Center
- • 2 - ADA restrooms
Listing Agents

Laurie Murphy-Zuiderhof
O: 443-756-5102
M: 443-756-5102
lmzuiderhof@murphycre.com
O: 443-756-5102
M: 443-756-5102
lmzuiderhof@murphycre.com
While we strive to provide the most accurate information, all listing information, and demographic data, is provided by third-parties. As such, MyEListing will not be responsible for the accuracy of the information. It is strongly recommended that you verify all information with the listing agent, and any relevant agencies, prior to making any decisions.