Commercial Land
13911 West Hardy Road Houston, TX 77060
13911 West Hardy Road Houston, TX 77060
Details & Description
Property Highlights
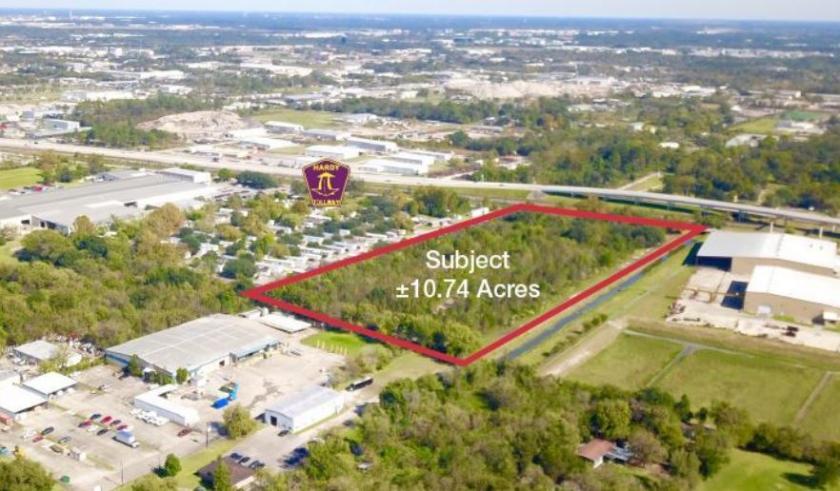
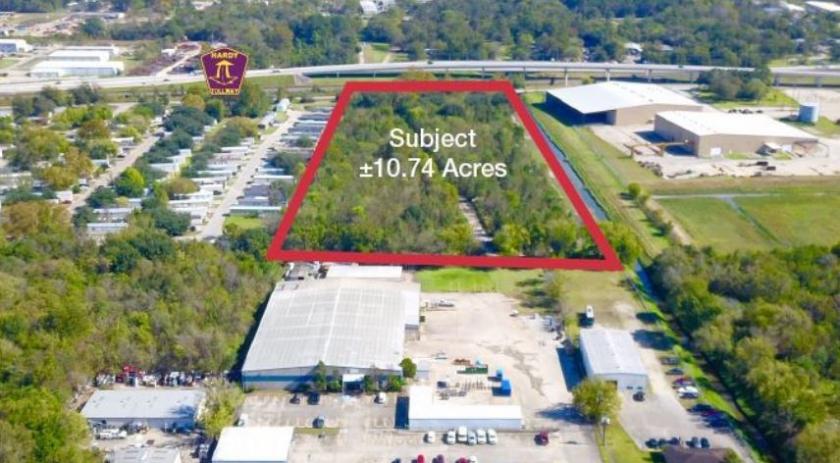
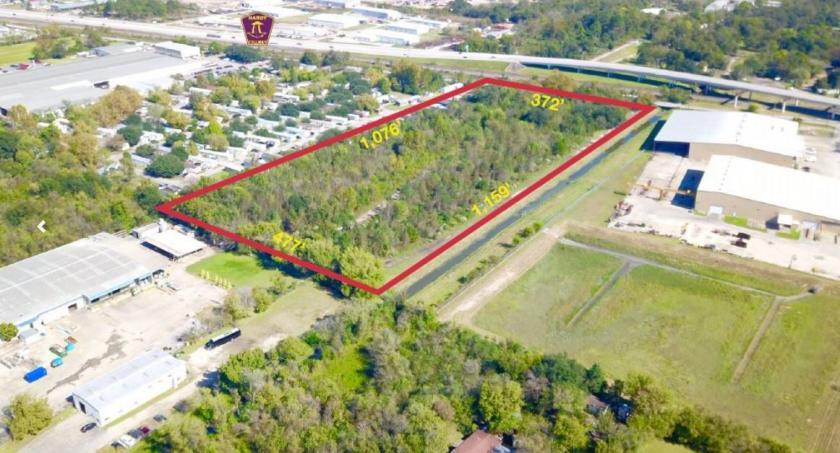
- • 10.74 Acres Total
- • 3.30 Acres Available for Building Development
- • 3.30 Acres Not Impacted by the Floodway
- • 7.44 Acres Impacted by the Floodway
- • May still be improved as laydown yard
- • 372 of Frontage Along Hardy Toll Road
Listing Agents

Zane Carman
O: 713-985-4418
M: 409-789-9029
zane.carman@partnersrealestate.com
O: 713-985-4418
M: 409-789-9029
zane.carman@partnersrealestate.com

Clay Pritchett
O: 713-985-4631
clay.pritchett@naipartners.com
O: 713-985-4631
clay.pritchett@naipartners.com
While we strive to provide the most accurate information, all listing information, and demographic data, is provided by third-parties. As such, MyEListing will not be responsible for the accuracy of the information. It is strongly recommended that you verify all information with the listing agent, and any relevant agencies, prior to making any decisions.