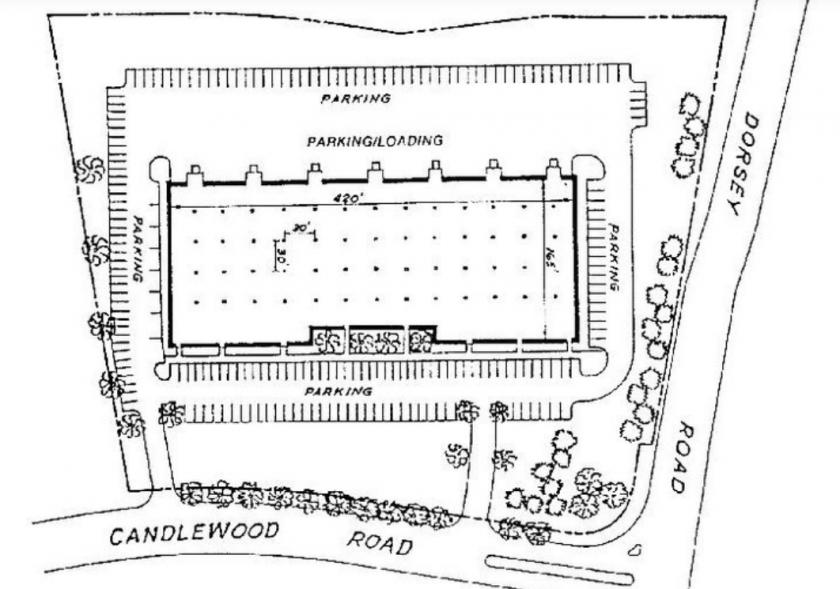
Flex-Office-Warehouse
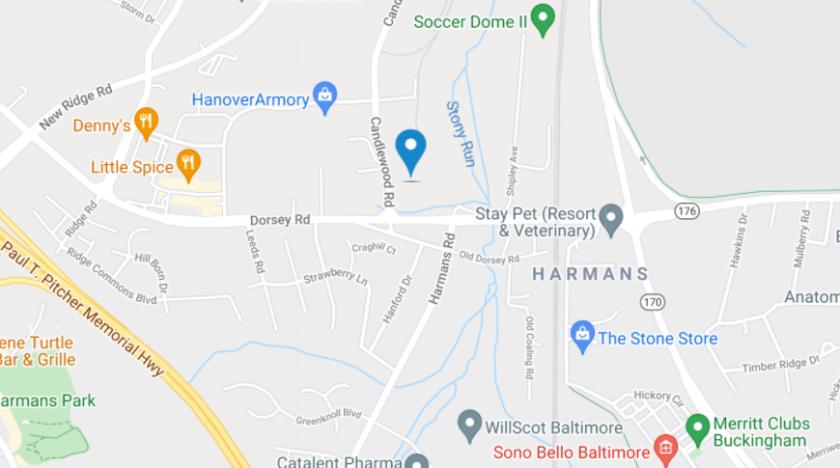
7483 Candlewood Road Hanover, MD 21076
7483 Candlewood Road Hanover, MD 21076
Details & Description
Property Highlights
- • Great Proximity to BWI airport
- • Very Competitive rates for the Market
- • Flex space with plenty of parking available
- • Easy access to I-95, Rt. 100 and I-97
Listing Agents

Joe Sera
O: 410-266-1113
M: 443-223-0371
jsera@murphycre.com
O: 410-266-1113
M: 443-223-0371
jsera@murphycre.com

Dennis Murphy
O: 410-266-1113
M: 301-919-7012
dmurphy@murphycre.com
O: 410-266-1113
M: 301-919-7012
dmurphy@murphycre.com
While we strive to provide the most accurate information, all listing information, and demographic data, is provided by third-parties. As such, MyEListing will not be responsible for the accuracy of the information. It is strongly recommended that you verify all information with the listing agent, and any relevant agencies, prior to making any decisions.