Retail Space
2941 Broadway Bend Drive Pearland, TX 77584
2941 Broadway Bend Drive Pearland, TX 77584
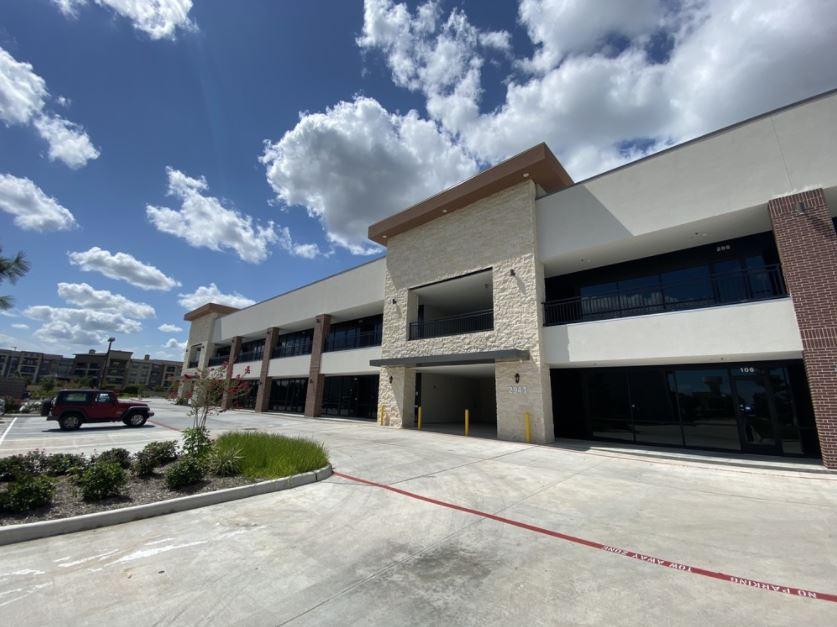
Details & Description
Property Highlights
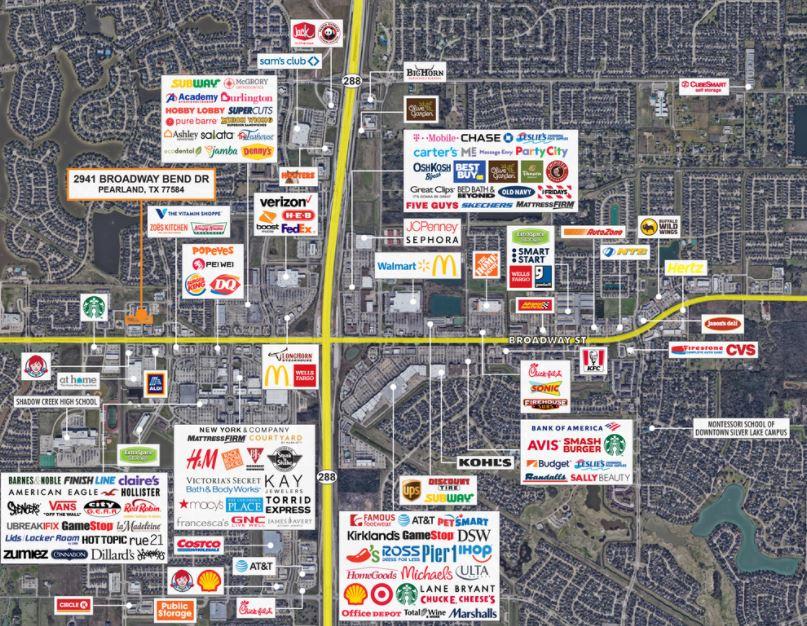
- • High-growth suburban area
- • Minutes from Texas Medical Center
- • Great for medical and professional office use
- • Close to Pearland Town Center and major hospitals
- • 55 Bay depths
- • Full floor availabilities
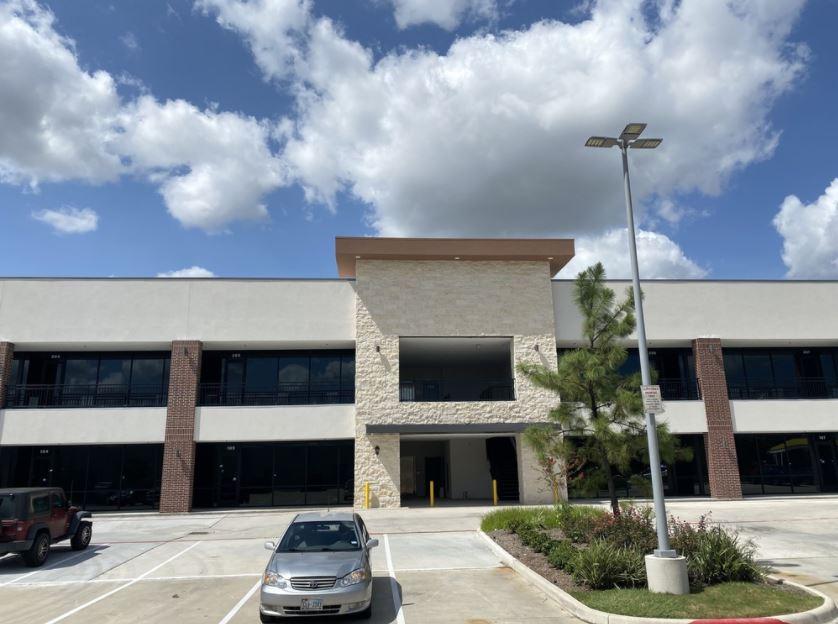
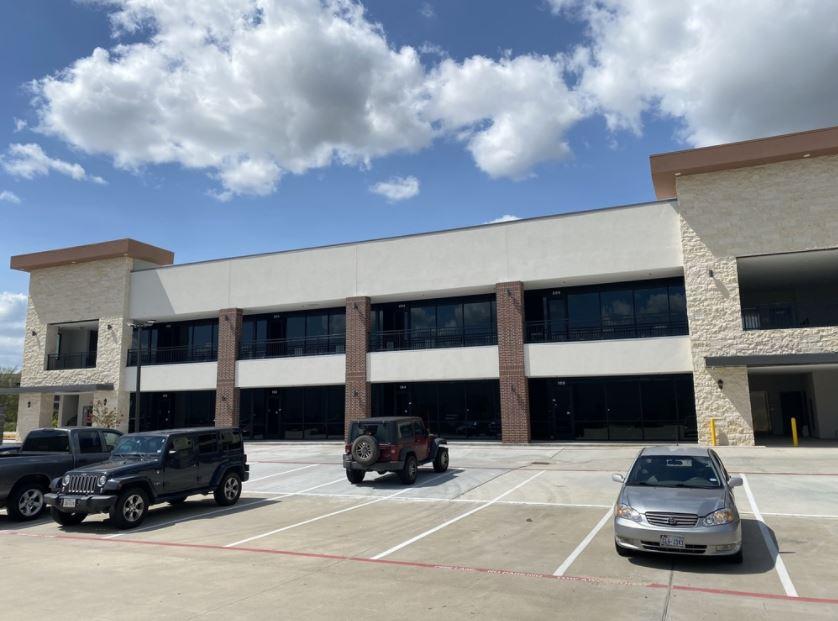
Additional Photos

Listing Agents

Zach Leger
O: 713-275-9605
zach.leger@partnersrealestate.com
O: 713-275-9605
zach.leger@partnersrealestate.com
While we strive to provide the most accurate information, all listing information, and demographic data, is provided by third-parties. As such, MyEListing will not be responsible for the accuracy of the information. It is strongly recommended that you verify all information with the listing agent, and any relevant agencies, prior to making any decisions.


