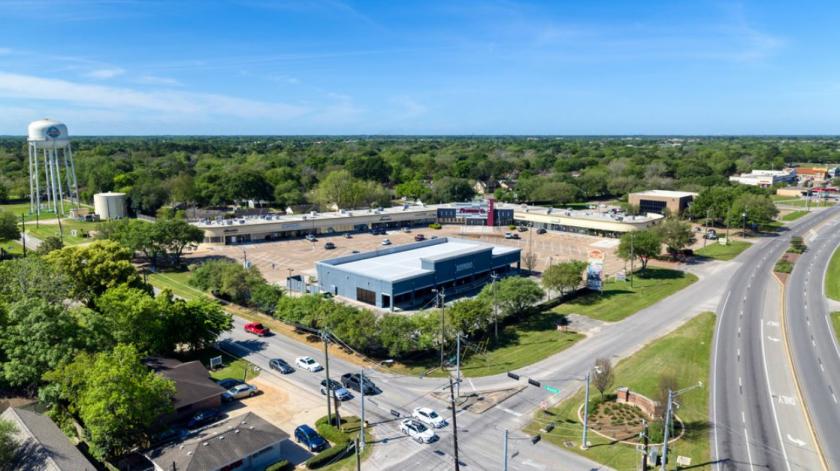
Retail Space
5040 Broadway Street Pearland, TX 77581
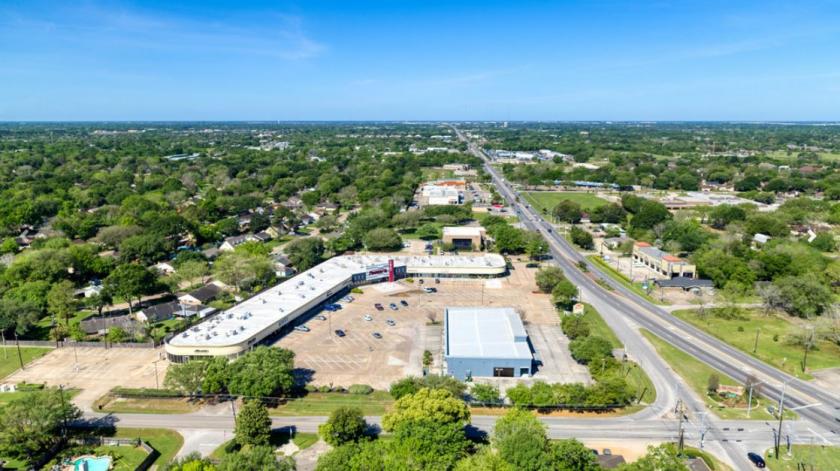
5040 Broadway Street Pearland, TX 77581
Details & Description
Property Highlights
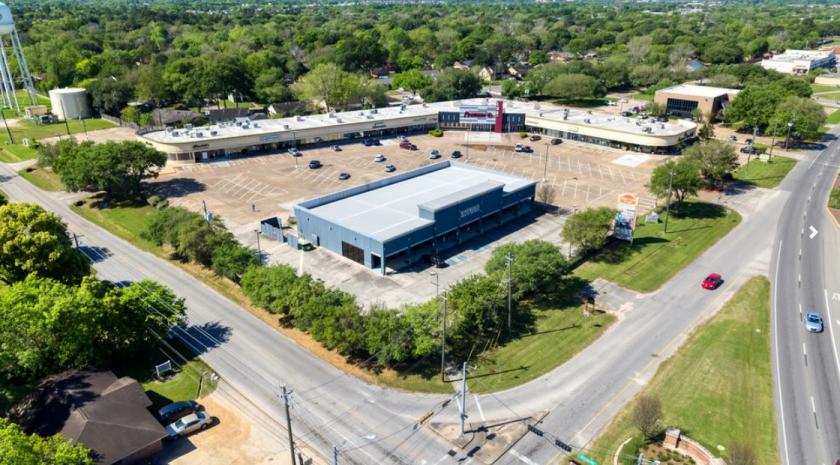
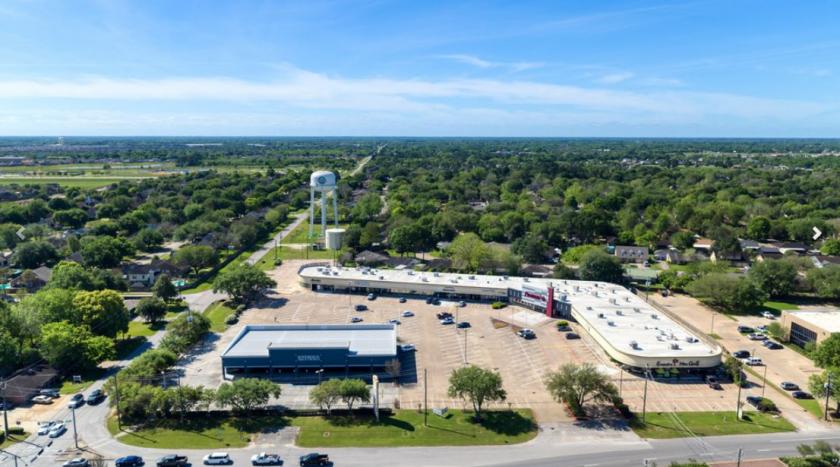
- • Great neighborhood center in the heart of Pearland
- • Ample parking
- • Hermann Sports Medicine Rehab
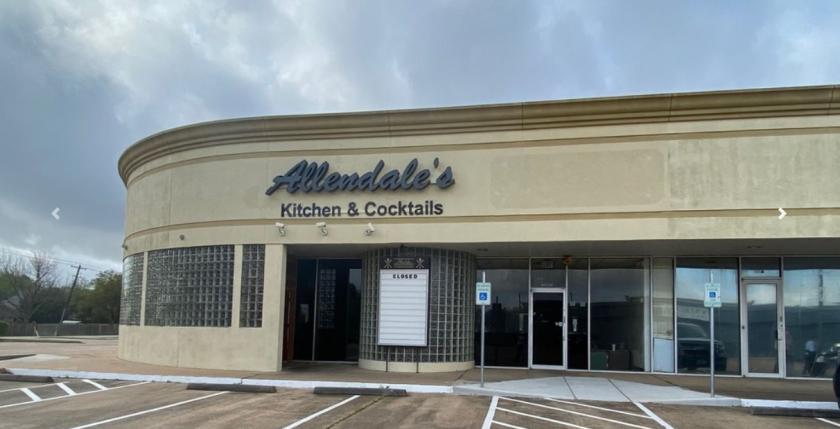
Additional Photos
Listing Agents

Zach Leger
O: 713-275-9605
zach.leger@partnersrealestate.com
O: 713-275-9605
zach.leger@partnersrealestate.com
While we strive to provide the most accurate information, all listing information, and demographic data, is provided by third-parties. As such, MyEListing will not be responsible for the accuracy of the information. It is strongly recommended that you verify all information with the listing agent, and any relevant agencies, prior to making any decisions.


