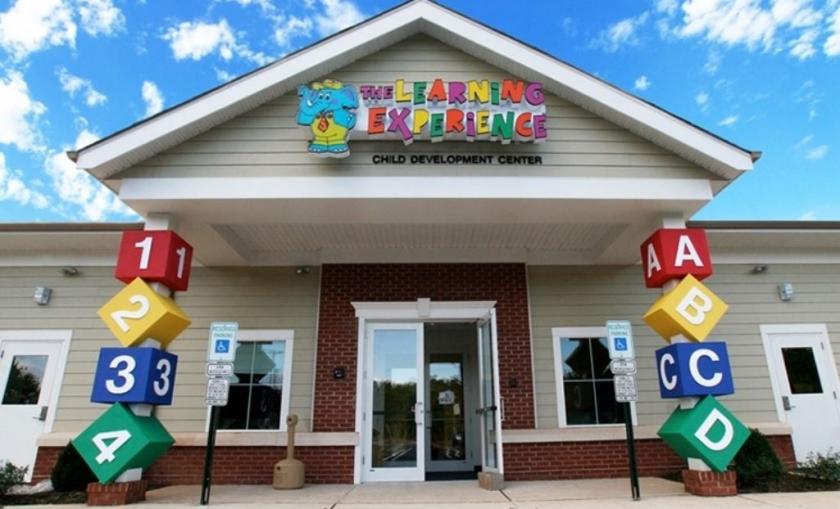
Specialty Real Estate
9554 Louetta Road Spring, TX 77379
9554 Louetta Road Spring, TX 77379
Details & Description
Property Highlights
- • Can be converted to outpatient medical use
- • Potential to build a drive-thru kiosk in the front
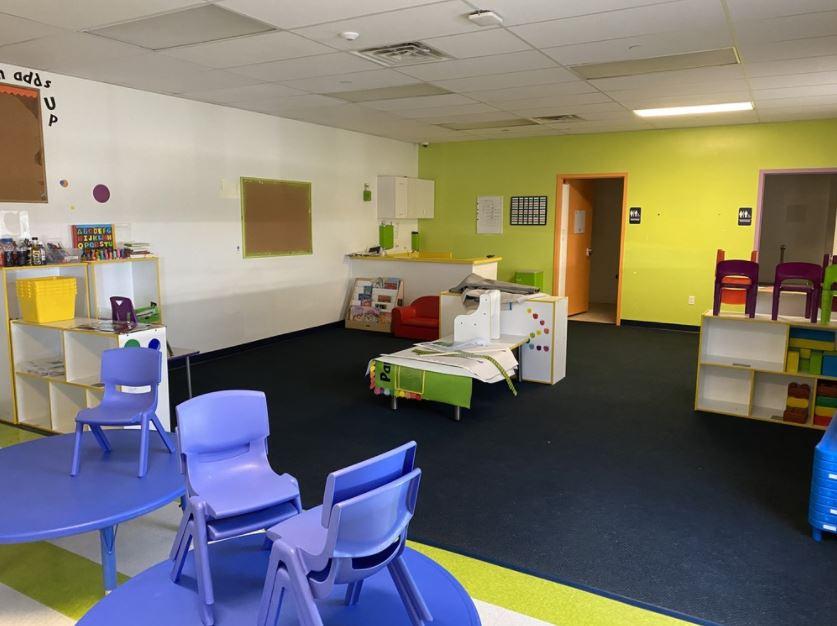
- • 10 classrooms and infant nursery
- • On-site laundrystorage
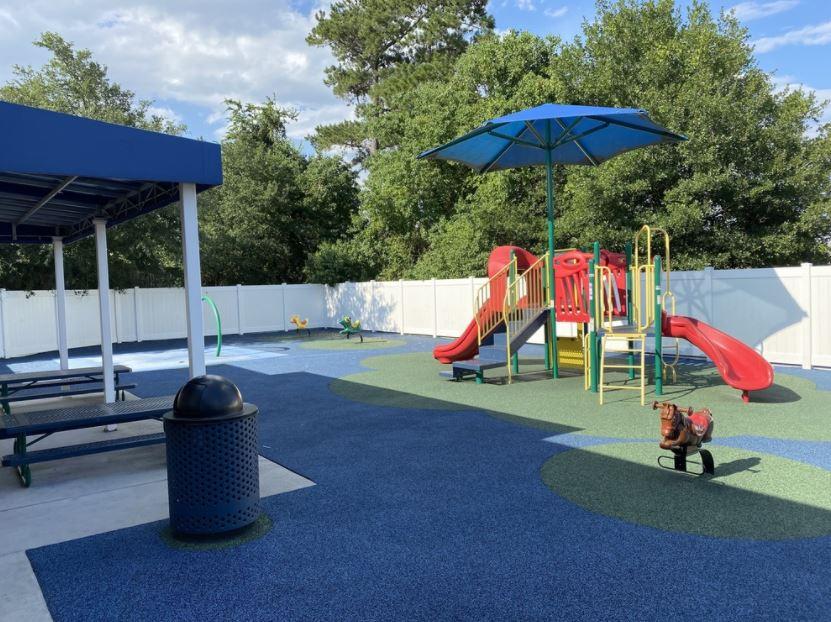
Additional Photos


Listing Agents

Zach Leger
O: 713-275-9605
zach.leger@partnersrealestate.com
O: 713-275-9605
zach.leger@partnersrealestate.com
While we strive to provide the most accurate information, all listing information, and demographic data, is provided by third-parties. As such, MyEListing will not be responsible for the accuracy of the information. It is strongly recommended that you verify all information with the listing agent, and any relevant agencies, prior to making any decisions.


