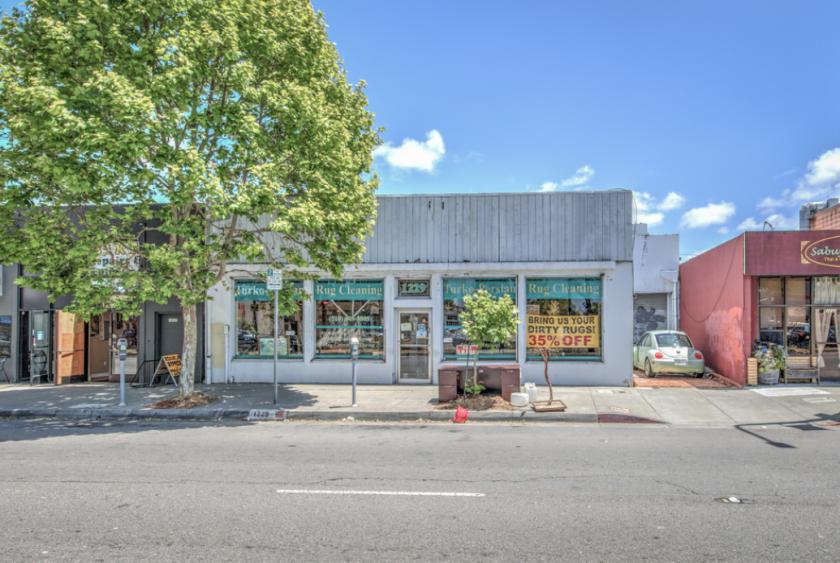
Retail Space
1229 San Pablo Avenue Berkeley, CA 94706
1229 San Pablo Avenue Berkeley, CA 94706
Details & Description
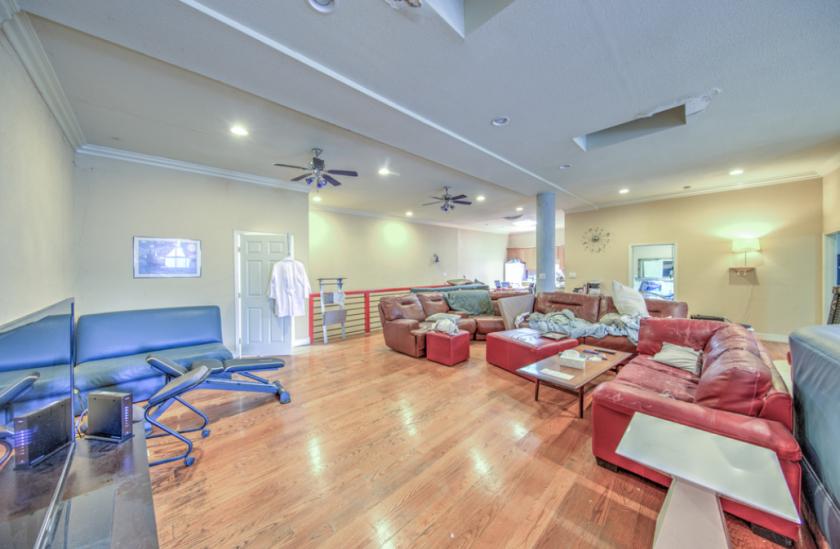
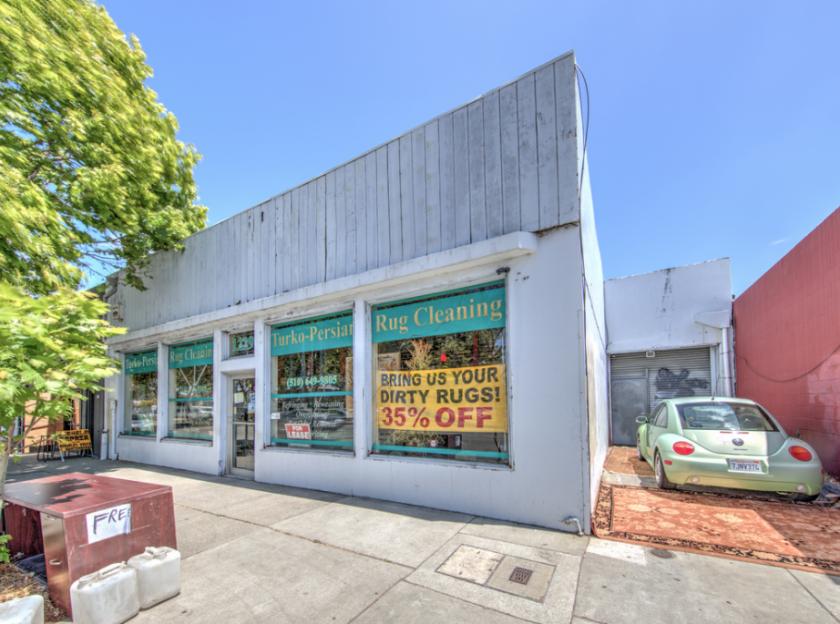
Additional Photos

Listing Agents

Kent Mitchell
O: 510-548-2554
M: 510-919-4919
kent@nainorcal.com
O: 510-548-2554
M: 510-919-4919
kent@nainorcal.com

Tim Warren
O: 510-336-4719
M: 707-363-2463
twarren@nainorcal.com
O: 510-336-4719
M: 707-363-2463
twarren@nainorcal.com

Randell Silva
O: 510-244-4667
M: 209-740-1251
rsilva@nainorcal.com
O: 510-244-4667
M: 209-740-1251
rsilva@nainorcal.com
While we strive to provide the most accurate information, all listing information, and demographic data, is provided by third-parties. As such, MyEListing will not be responsible for the accuracy of the information. It is strongly recommended that you verify all information with the listing agent, and any relevant agencies, prior to making any decisions.


