Retail Space
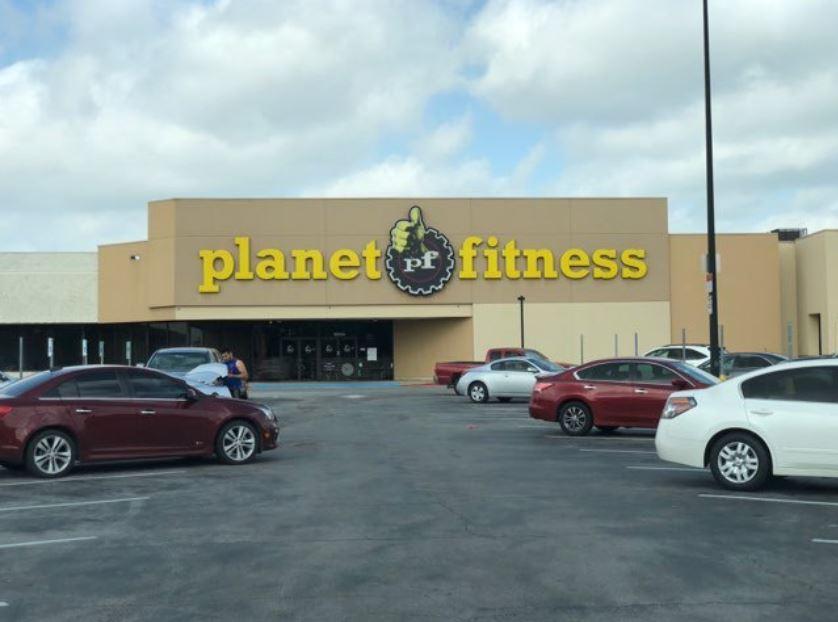
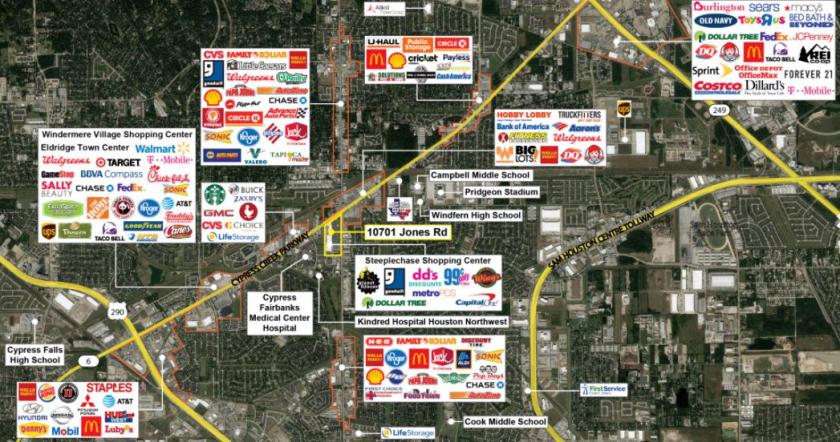
10701 Jones Road Houston, TX 77065
10701 Jones Road Houston, TX 77065
Details & Description
Property Highlights
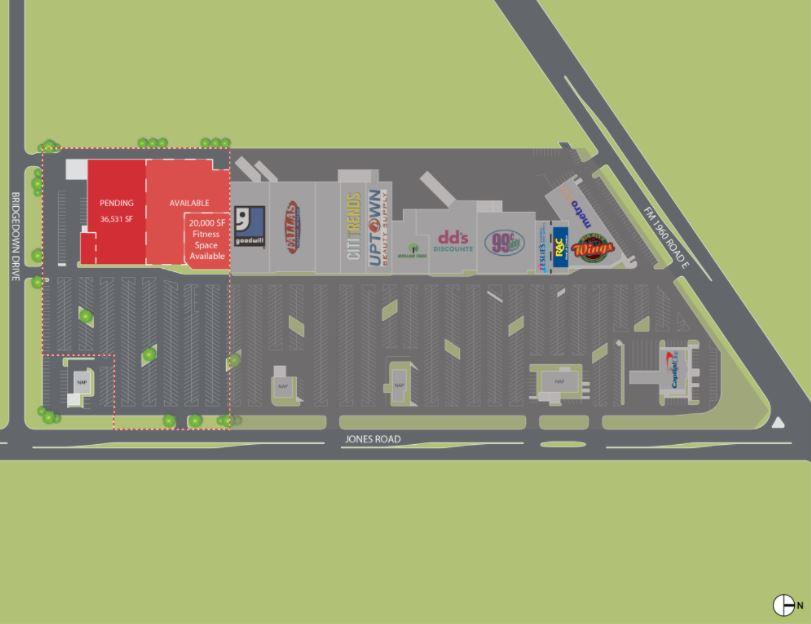
- • Large Anchor space ready to be subdivided
- • Total Square Footage 97,226 SF
- • Space Available 61,695 SF
- • Rental Rate $9.00 - $12.00SF
- • NNN $2.25
Listing Agents

Shaffer Braun
O: 713-275-9653
M: 713-562-4006
shaffer.braun@partnersrealestate.com
O: 713-275-9653
M: 713-562-4006
shaffer.braun@partnersrealestate.com
While we strive to provide the most accurate information, all listing information, and demographic data, is provided by third-parties. As such, MyEListing will not be responsible for the accuracy of the information. It is strongly recommended that you verify all information with the listing agent, and any relevant agencies, prior to making any decisions.