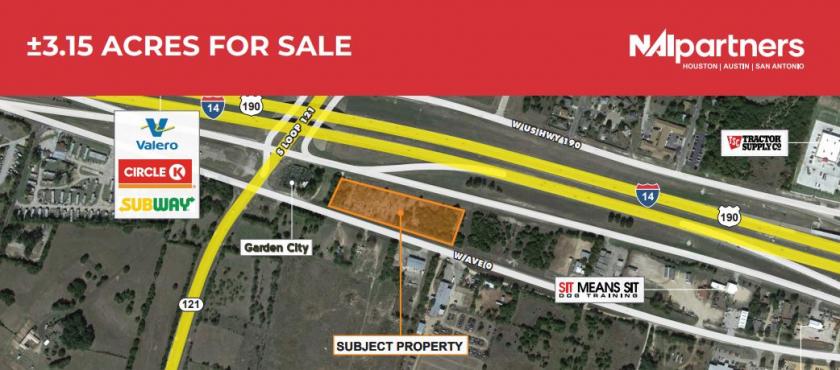
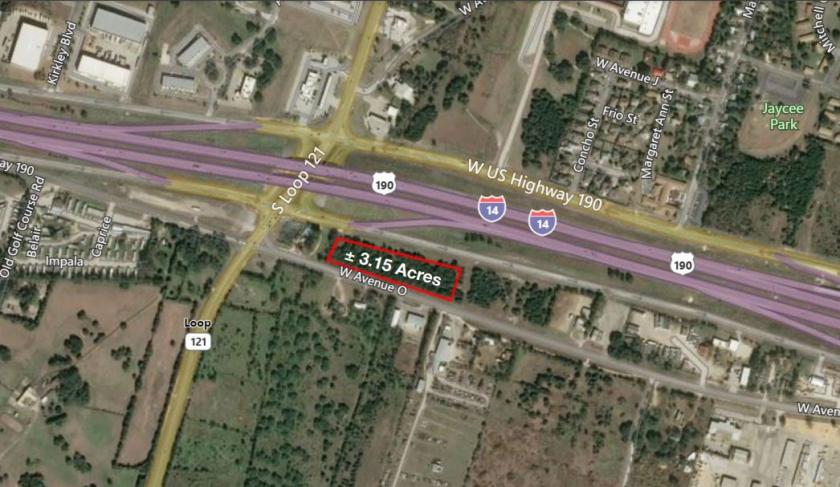
1-Mile | 3-Miles | 5-Miles | ||
---|---|---|---|---|
Total Population | 2,857 | 17,724 | 39,453 | |
Population Median Age | 33 | 33 | 35 | |
Population by Age | 0-9 Yrs | 443 (15%) | 2559 (14%) | 5769 (14%) |
10-19 Yrs | 453 (15%) | 3093 (17%) | 6554 (16%) | |
20-29 Yrs | 606 (21%) | 3712 (20%) | 6601 (16%) | |
30-39 Yrs | 404 (14%) | 2235 (12%) | 5189 (13%) | |
40-49 Yrs | 248 (8%) | 1733 (9%) | 4159 (10%) | |
50-59 Yrs | 251 (8%) | 1579 (8%) | 4254 (10%) | |
60-69 Yrs | 202 (7%) | 1338 (7%) | 3440 (8%) | |
70+ Yrs | 251 (8%) | 1474 (8%) | 3487 (8%) | |
Median HH Income | $47,217 | $54,003 | $64,735 | |
Total Household Income | < 24K | 307 (31%) | 1393 (24%) | 2702 (19%) |
25-49K | 206 (21%) | 1264 (22%) | 2477 (18%) | |
50-74K | 180 (18%) | 1027 (17%) | 2547 (18%) | |
75-99K | 69 (7%) | 604 (10%) | 1833 (13%) | |
100-199K | 190 (19%) | 1233 (21%) | 3267 (23%) | |
200K+ | 18 (1%) | 191 (3%) | 919 (6%) | |
Highest Education Level | No Diploma | 260 | 1521 | 2420 |
Diploma or GED | 700 | 3095 | 6028 | |
Some College | 408 | 2553 | 5573 | |
Assoc. Degree | 73 | 607 | 2092 | |
Bachelors Degree | 140 | 1155 | 3999 | |
Higher Degree | 68 | 825 | 3215 | |
Total Housing Units | 1,070 | 6,185 | 14,916 | |
--Owner-Occupied | 496 | 3,330 | 8,531 | |
--Renter-Occupied | 473 | 2,382 | 5,215 | |
Owner-Occupied Values | < 100K | 224 | 1211 | 1988 |
100-199K | 159 | 1070 | 3065 | |
200-299K | 80 | 628 | 1872 | |
300-399K | 29 | 264 | 807 | |
400-499K | 4 | 76 | 324 | |
500K+ | 0 | 80 | 475 | |
Total Working Age Population | 2,065 | 13,497 | 29,769 | |
In Work Force | 1,448 | 8,975 | 19,101 | |
Not In Work Force | 617 | 4,522 | 10,668 | |
Workforce Employed | 1,318 | 8,211 | 17,749 | |
Workforce Unemployed | 98 | 558 | 886 | |
Civlian Workforce | 1,416 | 8,769 | 18,635 | |
Military Workforce | 32 | 205 | 466 | |
Total Households | 969 | 5,711 | 13,745 | |
Family Households | 607 | 3,546 | 8,814 | |
Non-Family Households | 362 | 2,165 | 4,931 | |
Married Couple | 361 | 2,382 | 6,642 | |
Other Family | 246 | 1,164 | 2,172 | |
Married w/Child | 168 | 1,069 | 2,931 | |
Single Male w/Child | 29 | 159 | 286 | |
Single Female w/Child | 115 | 562 | 1,072 |
Population Change Last Two Decades - Plus Projection
2000 | % | 2010 | % | 2020 | % | 2030 | |
---|---|---|---|---|---|---|---|
Texas | 20,851,820 | +21 | 25,145,561 | +18 | 29,677,668 | +18 | 34,894,452 |
Bell County | 237,974 | +30 | 310,235 | +14 | 353,629 | +12 | 396,782 |
Coryell County | 74,978 | +1 | 75,388 | +4 | 78,317 | +5 | 82,198 |
Total Working Age Population:
Total Households:
Total Working Age Population:
Total Households:
Total Working Age Population:
Total Households: