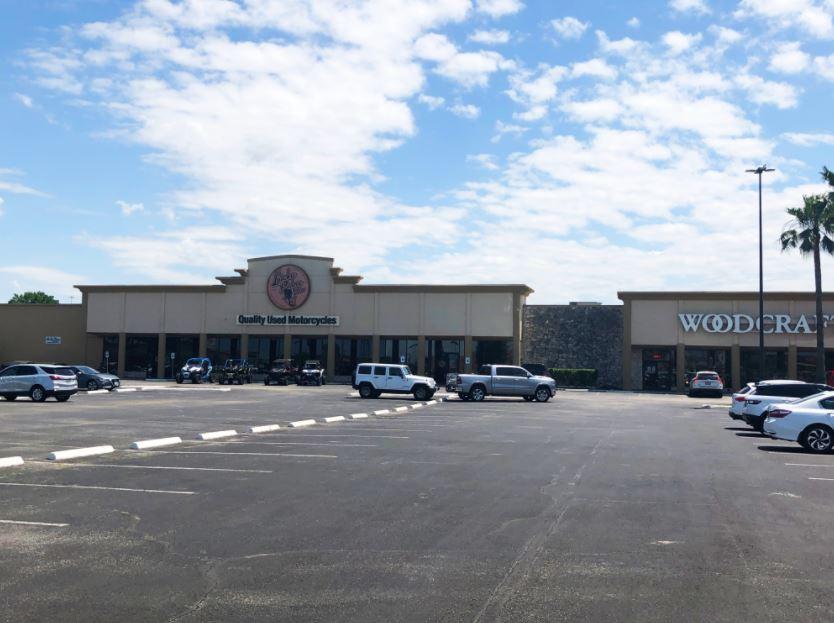
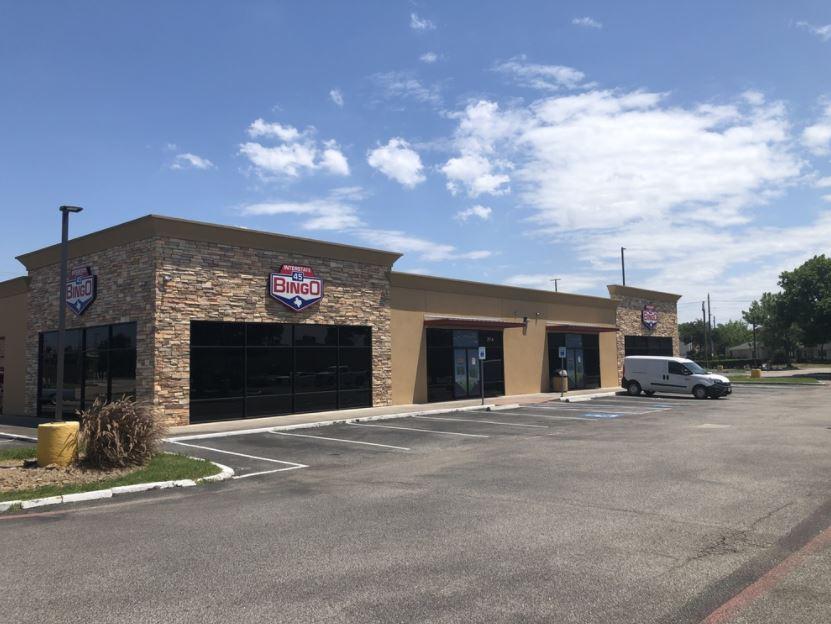
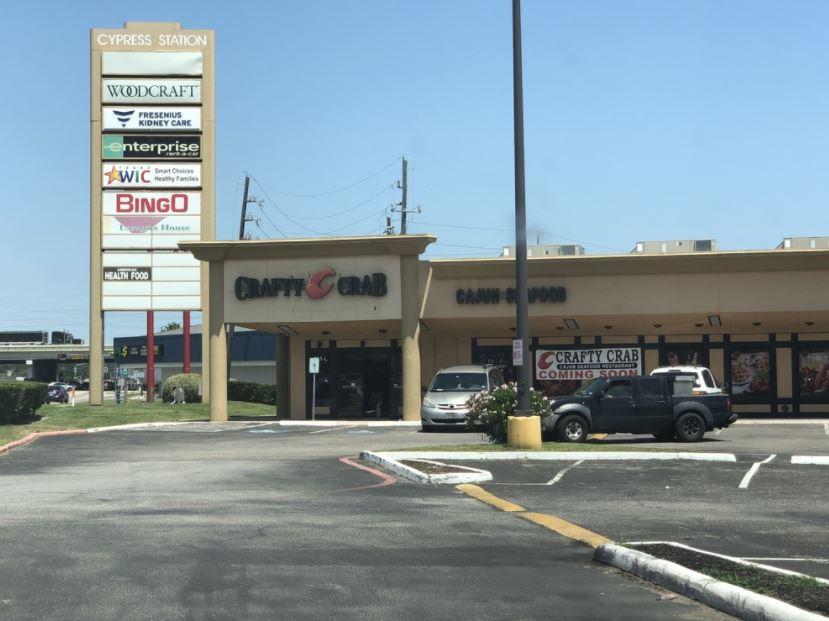
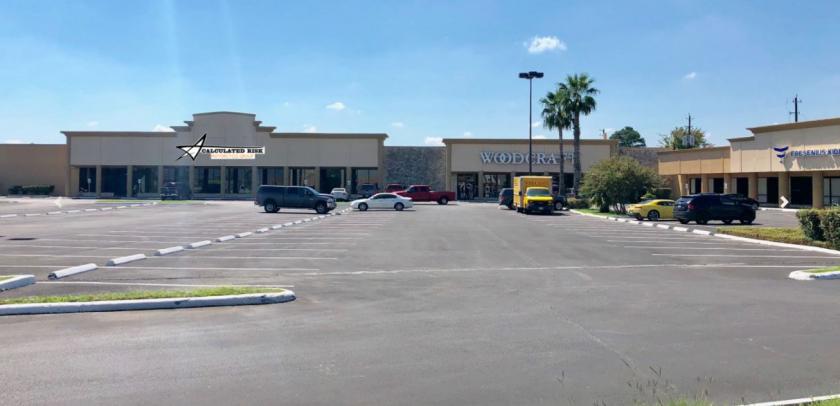
1-Mile | 3-Miles | 5-Miles | ||
---|---|---|---|---|
Total Population | 18,661 | 102,862 | 276,533 | |
Population Median Age | 30 | 33 | 33 | |
Population by Age | 0-9 Yrs | 3564 (19%) | 17353 (16%) | 43527 (15%) |
10-19 Yrs | 2627 (14%) | 14958 (14%) | 42740 (15%) | |
20-29 Yrs | 3881 (20%) | 16469 (16%) | 41369 (14%) | |
30-39 Yrs | 3069 (16%) | 16439 (15%) | 43568 (15%) | |
40-49 Yrs | 1992 (10%) | 13554 (13%) | 38469 (13%) | |
50-59 Yrs | 1897 (10%) | 10919 (10%) | 30415 (10%) | |
60-69 Yrs | 963 (5%) | 7350 (7%) | 22113 (7%) | |
70+ Yrs | 667 (3%) | 5820 (5%) | 14330 (5%) | |
Median HH Income | $37,793 | $51,459 | $58,384 | |
Total Household Income | < 24K | 2226 (28%) | 7683 (20%) | 16745 (17%) |
25-49K | 2569 (33%) | 10675 (28%) | 23416 (24%) | |
50-74K | 1861 (24%) | 7457 (19%) | 18255 (19%) | |
75-99K | 388 (5%) | 3637 (9%) | 11852 (12%) | |
100-199K | 652 (8%) | 6532 (17%) | 19199 (20%) | |
200K+ | 46 (0%) | 1735 (4%) | 4638 (4%) | |
Highest Education Level | No Diploma | 1557 | 8981 | 25782 |
Diploma or GED | 2961 | 16106 | 43529 | |
Some College | 3272 | 16834 | 43315 | |
Assoc. Degree | 1070 | 5723 | 15958 | |
Bachelors Degree | 1223 | 10471 | 29253 | |
Higher Degree | 524 | 4617 | 12861 | |
Total Housing Units | 8,880 | 42,101 | 102,520 | |
--Owner-Occupied | 1,375 | 16,445 | 49,080 | |
--Renter-Occupied | 6,367 | 21,275 | 45,025 | |
Owner-Occupied Values | < 100K | 264 | 1514 | 5531 |
100-199K | 1018 | 10231 | 28707 | |
200-299K | 86 | 3303 | 10466 | |
300-399K | 2 | 762 | 2567 | |
400-499K | 4 | 335 | 878 | |
500K+ | 0 | 300 | 932 | |
Total Working Age Population | 13,439 | 76,721 | 207,344 | |
In Work Force | 10,031 | 54,145 | 144,752 | |
Not In Work Force | 3,408 | 22,577 | 62,592 | |
Workforce Employed | 9,478 | 51,100 | 136,849 | |
Workforce Unemployed | 553 | 3,023 | 7,842 | |
Civlian Workforce | 10,031 | 54,122 | 144,691 | |
Military Workforce | 0 | 22 | 61 | |
Total Households | 7,741 | 37,720 | 94,104 | |
Family Households | 4,215 | 24,535 | 66,226 | |
Non-Family Households | 3,526 | 13,184 | 27,878 | |
Married Couple | 1,769 | 15,189 | 43,690 | |
Other Family | 2,446 | 9,347 | 22,536 | |
Married w/Child | 948 | 6,924 | 20,640 | |
Single Male w/Child | 242 | 1,055 | 2,512 | |
Single Female w/Child | 1,465 | 4,961 | 11,268 |
Population Change Last Two Decades - Plus Projection
2000 | % | 2010 | % | 2020 | % | 2030 | |
---|---|---|---|---|---|---|---|
Texas | 20,851,820 | +21 | 25,145,561 | +18 | 29,677,668 | +18 | 34,894,452 |
Harris County | 3,400,578 | +20 | 4,092,459 | +22 | 4,978,845 | +19 | 5,924,750 |
Montgomery County | 293,768 | +55 | 455,746 | +35 | 613,951 | +35 | 831,450 |
Total Working Age Population:
Total Households:
Total Working Age Population:
Total Households:
Total Working Age Population:
Total Households: