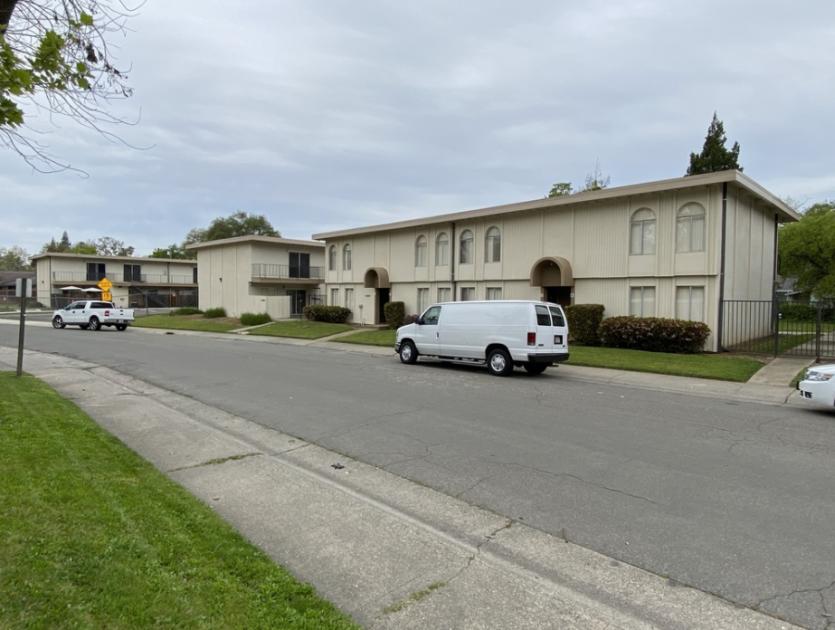
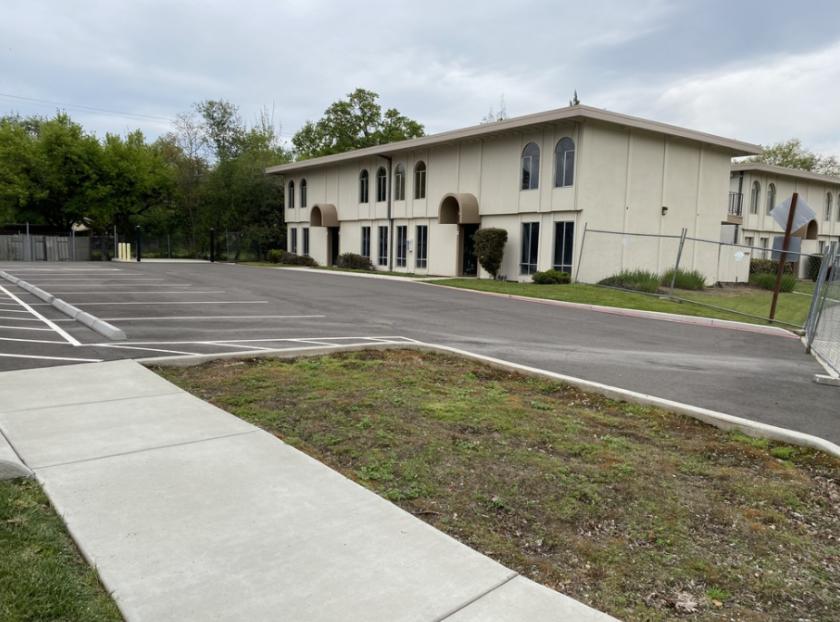
1-Mile | 3-Miles | 5-Miles | ||
---|---|---|---|---|
Total Population | 16,437 | 136,707 | 364,200 | |
Population Median Age | 41 | 40 | 39 | |
Population by Age | 0-9 Yrs | 2162 (13%) | 15906 (11%) | 44997 (12%) |
10-19 Yrs | 1470 (8%) | 14939 (10%) | 43065 (11%) | |
20-29 Yrs | 2013 (12%) | 19314 (14%) | 50944 (13%) | |
30-39 Yrs | 2674 (16%) | 19946 (14%) | 52692 (14%) | |
40-49 Yrs | 1567 (9%) | 14989 (10%) | 41570 (11%) | |
50-59 Yrs | 2476 (15%) | 17933 (13%) | 47990 (13%) | |
60-69 Yrs | 2057 (12%) | 17247 (12%) | 43746 (12%) | |
70+ Yrs | 2018 (12%) | 16432 (12%) | 39195 (10%) | |
Median HH Income | $77,575 | $64,949 | $65,799 | |
Total Household Income | < 24K | 835 (13%) | 9349 (17%) | 22578 (16%) |
25-49K | 942 (15%) | 11128 (20%) | 28707 (20%) | |
50-74K | 1250 (19%) | 10681 (19%) | 26706 (19%) | |
75-99K | 1089 (17%) | 7950 (14%) | 19737 (14%) | |
100-199K | 1707 (27%) | 11884 (21%) | 31216 (22%) | |
200K+ | 456 (7%) | 3474 (6%) | 8317 (6%) | |
Highest Education Level | No Diploma | 990 | 7671 | 22599 |
Diploma or GED | 2273 | 21031 | 61172 | |
Some College | 3719 | 29162 | 72113 | |
Assoc. Degree | 1377 | 11482 | 27819 | |
Bachelors Degree | 2181 | 18905 | 47531 | |
Higher Degree | 1300 | 9466 | 22674 | |
Total Housing Units | 6,607 | 57,202 | 143,694 | |
--Owner-Occupied | 4,157 | 30,139 | 79,077 | |
--Renter-Occupied | 2,123 | 24,327 | 58,183 | |
Owner-Occupied Values | < 100K | 81 | 1368 | 4589 |
100-199K | 355 | 2469 | 6815 | |
200-299K | 901 | 6705 | 19779 | |
300-399K | 1697 | 10193 | 24704 | |
400-499K | 704 | 4639 | 11282 | |
500K+ | 418 | 4766 | 11909 | |
Total Working Age Population | 13,399 | 111,684 | 292,488 | |
In Work Force | 8,633 | 69,813 | 182,743 | |
Not In Work Force | 4,766 | 41,870 | 109,744 | |
Workforce Employed | 8,137 | 65,903 | 171,316 | |
Workforce Unemployed | 491 | 3,837 | 11,166 | |
Civlian Workforce | 8,628 | 69,740 | 182,482 | |
Military Workforce | 5 | 73 | 261 | |
Total Households | 6,280 | 54,466 | 137,260 | |
Family Households | 3,986 | 33,598 | 89,842 | |
Non-Family Households | 2,294 | 20,868 | 47,418 | |
Married Couple | 2,811 | 23,369 | 62,165 | |
Other Family | 1,174 | 10,228 | 27,676 | |
Married w/Child | 1,101 | 8,840 | 24,562 | |
Single Male w/Child | 148 | 1,491 | 4,102 | |
Single Female w/Child | 298 | 3,321 | 9,076 |
Population Change Last Two Decades - Plus Projection
2000 | % | 2010 | % | 2020 | % | 2030 | |
---|---|---|---|---|---|---|---|
California | 33,871,648 | +10 | 37,253,956 | +9 | 40,467,295 | +8 | 43,631,295 |
Placer County | 248,399 | +40 | 348,432 | +15 | 399,388 | +14 | 456,175 |
Sacramento County | 1,223,499 | +16 | 1,418,788 | +11 | 1,572,195 | +12 | 1,758,565 |
Total Working Age Population:
Total Households:
Total Working Age Population:
Total Households:
Total Working Age Population:
Total Households: