Industrial Properties
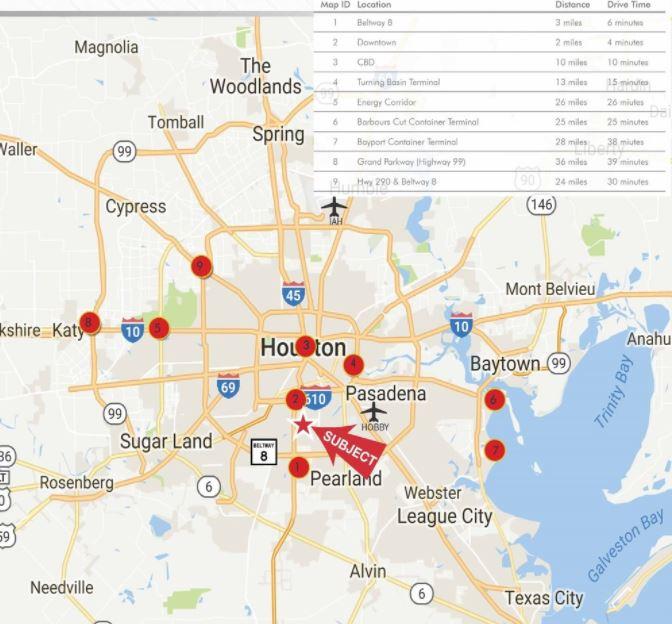
Hwy 288 South and Airport Blvd Houston, TX 77051
Hwy 288 South and Airport Blvd Houston, TX 77051
Details & Description
Property Highlights
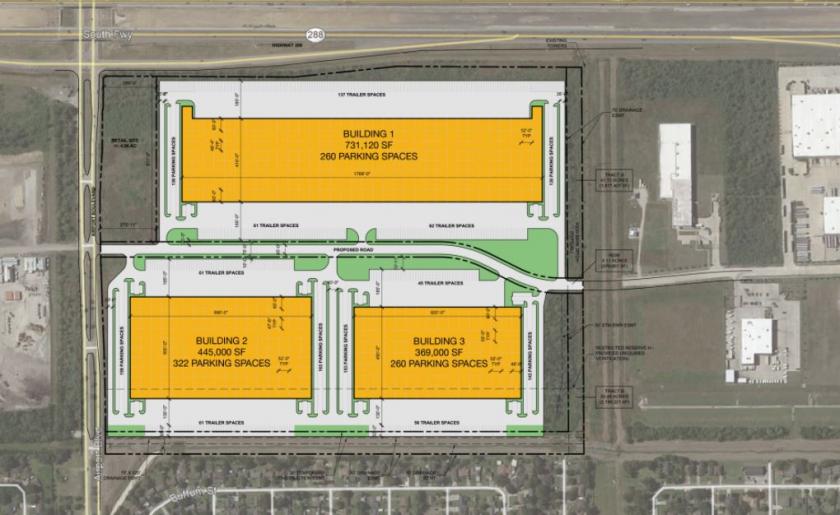
- • 1.54 Million SF of Improvements at Completion
- • Phase I Building I 731,120 SF
- • 92-Acre Proposed Master Planned Business Park
- • Direct Access to W. Airport and Reed Road
- • Extensive Visibility and Signage Along Hwy 288
- • 185 Truck Courts
Listing Agents

Michael Keegan
O: 713-275-9630
michael.keegan@naipartners.com
O: 713-275-9630
michael.keegan@naipartners.com

Clay Pritchett
O: 713-985-4631
clay.pritchett@naipartners.com
O: 713-985-4631
clay.pritchett@naipartners.com

Zane Carman
O: 713-985-4418
M: 409-789-9029
zane.carman@partnersrealestate.com
O: 713-985-4418
M: 409-789-9029
zane.carman@partnersrealestate.com
While we strive to provide the most accurate information, all listing information, and demographic data, is provided by third-parties. As such, MyEListing will not be responsible for the accuracy of the information. It is strongly recommended that you verify all information with the listing agent, and any relevant agencies, prior to making any decisions.