Commercial Land
US 290 ear FM 362 Waller, TX 77484
US 290 ear FM 362 Waller, TX 77484
Details & Description
Property Highlights
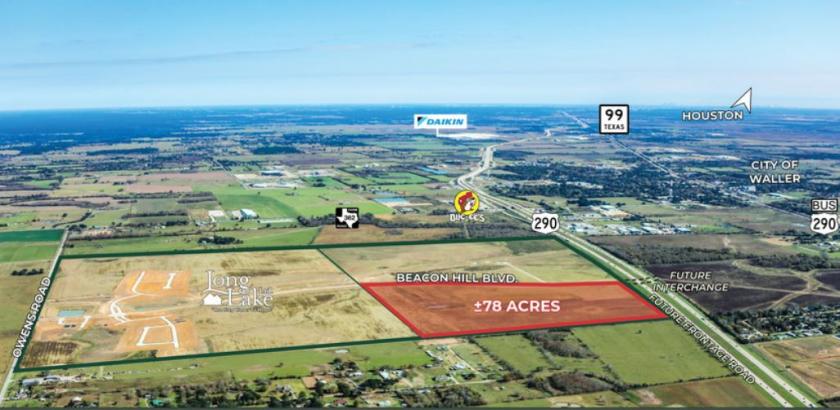
- • 78 acres available for industrial development
- • Utilities in-place
- • Located in the City of Waller, Waller County
- • Tax incentives available
- • CenterPoint provides electrical power in the area
- • Nearly 6,000 of frontage on U.S. 290
Listing Agents

John Simons
O: 713-275-9634
john.simons@partnersrealestate.com
O: 713-275-9634
john.simons@partnersrealestate.com

Chris Haro
O: 713-275-9620
chris.haro@naipartners.com
O: 713-275-9620
chris.haro@naipartners.com

Gray Gilbert
O: 713-301-7252
gray.gilbert@naipartners.com
O: 713-301-7252
gray.gilbert@naipartners.com
While we strive to provide the most accurate information, all listing information, and demographic data, is provided by third-parties. As such, MyEListing will not be responsible for the accuracy of the information. It is strongly recommended that you verify all information with the listing agent, and any relevant agencies, prior to making any decisions.


