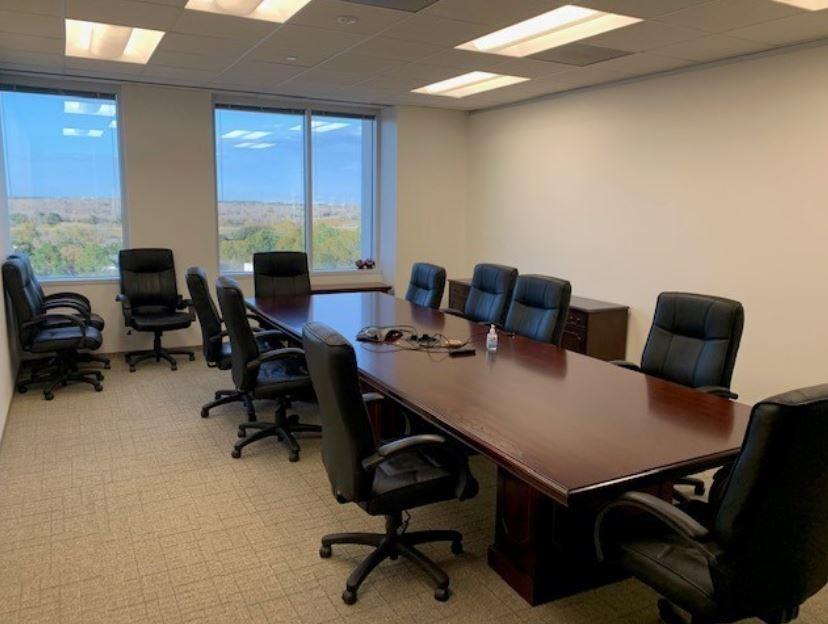
Office Space
11700 Katy Freeway Houston, TX 77079
11700 Katy Freeway Houston, TX 77079
Details & Description
Property Highlights
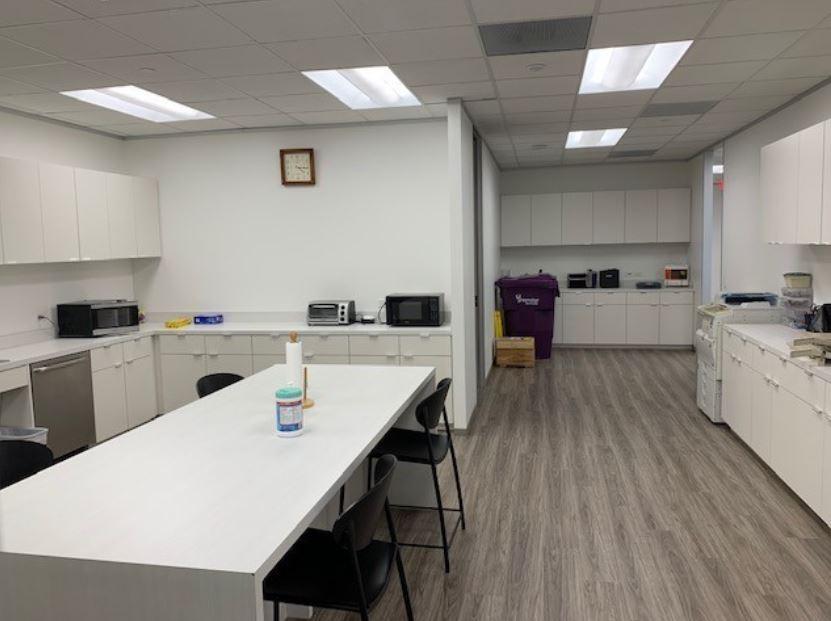
- • New buildout
- • Primarily open plan
- • Well-spaced workstations
- • Furniture negotiable
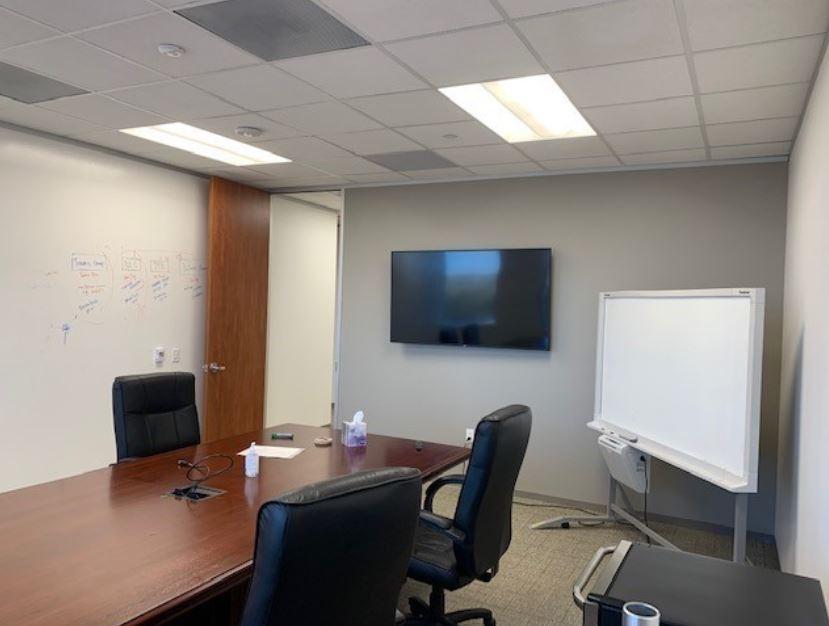
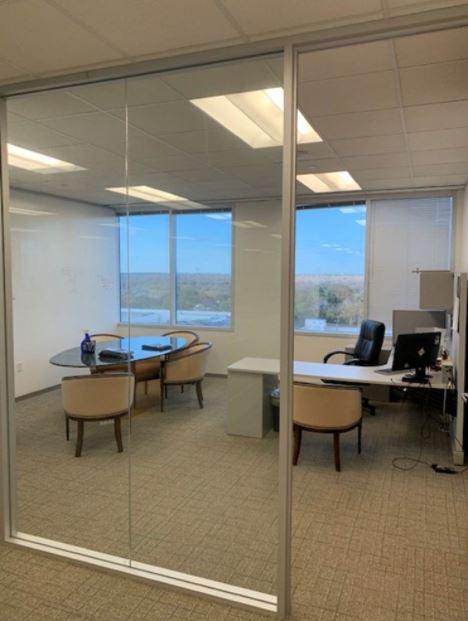
Additional Photos


Listing Agents

Joe Bright
O: 210-876-2244
joe.bright@partnersrealestate.com
O: 210-876-2244
joe.bright@partnersrealestate.com

Griff Bandy
O: 713-985-4411
griff.bandy@partnersrealestate.com
O: 713-985-4411
griff.bandy@partnersrealestate.com
While we strive to provide the most accurate information, all listing information, and demographic data, is provided by third-parties. As such, MyEListing will not be responsible for the accuracy of the information. It is strongly recommended that you verify all information with the listing agent, and any relevant agencies, prior to making any decisions.