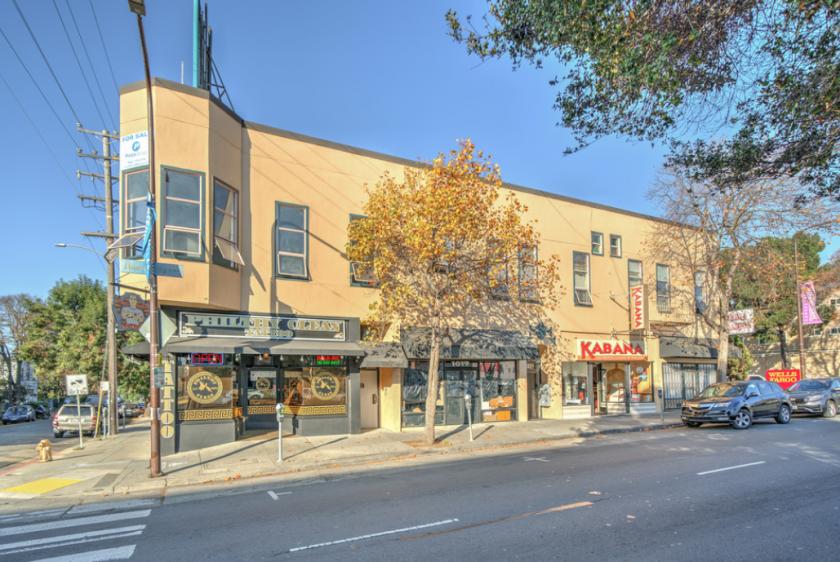
Retail Space
1015 University Avenue Berkeley, CA 94710
1015 University Avenue Berkeley, CA 94710
Details & Description
Property Highlights
- • Fully occupied and up-to-date rent collections
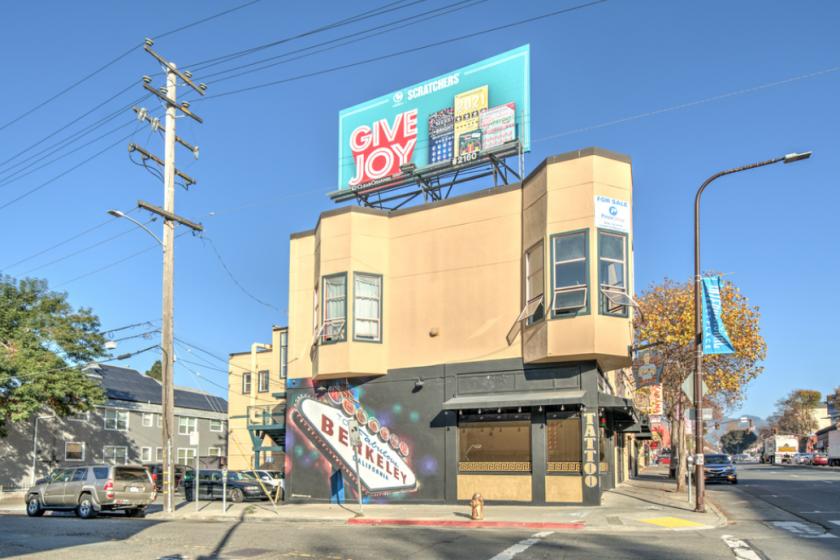
- • Additional billboard income
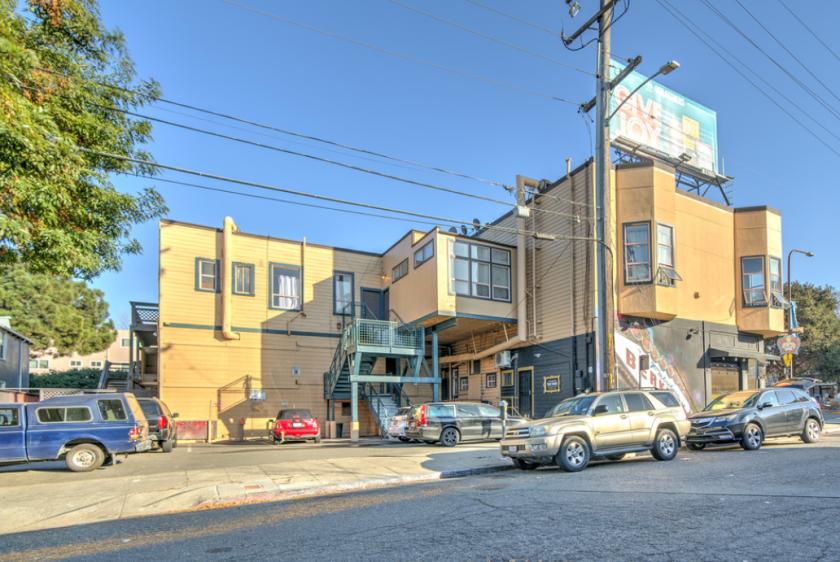
- • Off-street parking and on-site laundry
Additional Photos

Listing Agents

Randell Silva
O: 510-244-4667
M: 209-740-1251
rsilva@nainorcal.com
O: 510-244-4667
M: 209-740-1251
rsilva@nainorcal.com

Tim Warren
O: 510-336-4719
M: 707-363-2463
twarren@nainorcal.com
O: 510-336-4719
M: 707-363-2463
twarren@nainorcal.com

Kent Mitchell
O: 510-548-2554
M: 510-919-4919
kent@nainorcal.com
O: 510-548-2554
M: 510-919-4919
kent@nainorcal.com
While we strive to provide the most accurate information, all listing information, and demographic data, is provided by third-parties. As such, MyEListing will not be responsible for the accuracy of the information. It is strongly recommended that you verify all information with the listing agent, and any relevant agencies, prior to making any decisions.


