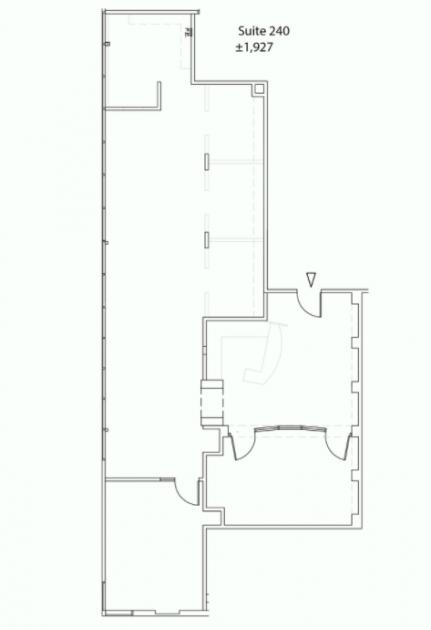
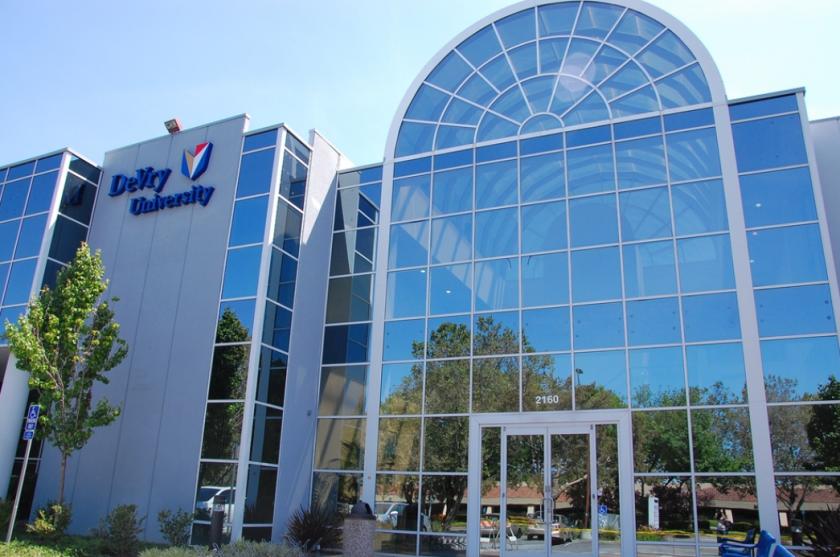
1-Mile | 3-Miles | 5-Miles | ||
---|---|---|---|---|
Total Population | 22,909 | 181,792 | 451,858 | |
Population Median Age | 37 | 37 | 36 | |
Population by Age | 0-9 Yrs | 2776 (12%) | 21485 (11%) | 53074 (11%) |
10-19 Yrs | 1547 (6%) | 16465 (9%) | 51845 (11%) | |
20-29 Yrs | 4274 (18%) | 31793 (17%) | 84778 (18%) | |
30-39 Yrs | 5227 (22%) | 35289 (19%) | 78168 (17%) | |
40-49 Yrs | 3133 (13%) | 23950 (13%) | 59697 (13%) | |
50-59 Yrs | 2299 (10%) | 21823 (12%) | 51983 (11%) | |
60-69 Yrs | 2130 (9%) | 17381 (9%) | 38877 (8%) | |
70+ Yrs | 1522 (6%) | 13607 (7%) | 33435 (7%) | |
Median HH Income | $123,776 | $128,228 | $109,812 | |
Total Household Income | < 24K | 712 (9%) | 5616 (9%) | 17228 (12%) |
25-49K | 657 (8%) | 5560 (9%) | 16984 (12%) | |
50-74K | 705 (9%) | 5591 (9%) | 15910 (11%) | |
75-99K | 894 (11%) | 5524 (9%) | 14449 (10%) | |
100-199K | 2593 (34%) | 20855 (36%) | 45818 (32%) | |
200K+ | 1955 (26%) | 14635 (25%) | 29360 (21%) | |
Highest Education Level | No Diploma | 1904 | 17019 | 51244 |
Diploma or GED | 2422 | 19284 | 53141 | |
Some College | 1793 | 16351 | 45152 | |
Assoc. Degree | 1167 | 10411 | 22317 | |
Bachelors Degree | 5125 | 38130 | 79073 | |
Higher Degree | 4683 | 30664 | 58275 | |
Total Housing Units | 7,925 | 60,651 | 146,895 | |
--Owner-Occupied | 3,935 | 31,960 | 66,265 | |
--Renter-Occupied | 3,581 | 25,822 | 73,484 | |
Owner-Occupied Values | < 100K | 142 | 913 | 2062 |
100-199K | 84 | 870 | 1670 | |
200-299K | 45 | 400 | 1176 | |
300-399K | 66 | 671 | 2014 | |
400-499K | 136 | 1214 | 3531 | |
500K+ | 3462 | 27891 | 55812 | |
Total Working Age Population | 19,153 | 149,882 | 370,242 | |
In Work Force | 13,403 | 103,880 | 255,205 | |
Not In Work Force | 5,750 | 46,002 | 115,037 | |
Workforce Employed | 12,772 | 98,754 | 242,334 | |
Workforce Unemployed | 631 | 5,076 | 12,625 | |
Civlian Workforce | 13,403 | 103,830 | 254,959 | |
Military Workforce | 0 | 50 | 246 | |
Total Households | 7,516 | 57,782 | 139,749 | |
Family Households | 5,503 | 42,738 | 97,074 | |
Non-Family Households | 2,013 | 15,044 | 42,675 | |
Married Couple | 4,546 | 34,223 | 73,607 | |
Other Family | 957 | 8,515 | 23,467 | |
Married w/Child | 2,036 | 15,005 | 32,973 | |
Single Male w/Child | 115 | 1,258 | 3,335 | |
Single Female w/Child | 179 | 1,804 | 5,777 |
Population Change Last Two Decades - Plus Projection
2000 | % | 2010 | % | 2020 | % | 2030 | |
---|---|---|---|---|---|---|---|
California | 33,871,648 | +10 | 37,253,956 | +9 | 40,467,295 | +8 | 43,631,295 |
Alameda County | 1,443,741 | +5 | 1,510,271 | +12 | 1,696,752 | +10 | 1,861,027 |
Santa Clara County | 1,682,585 | +6 | 1,781,642 | +12 | 1,996,394 | +10 | 2,194,079 |
Total Working Age Population:
Total Households:
Total Working Age Population:
Total Households:
Total Working Age Population:
Total Households: