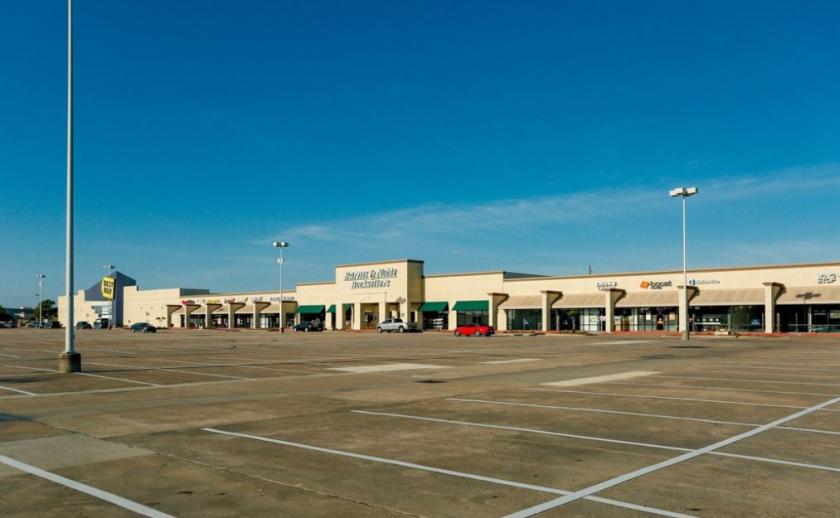
A-Class power center at the confluence of the busiest street in Houston and the busiest highway throughout in Houston
High population density, high traffic over 105,800 cars per day
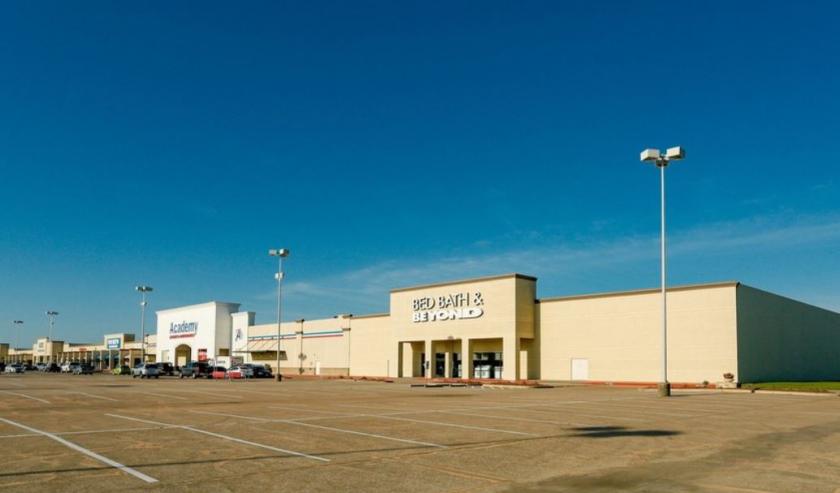
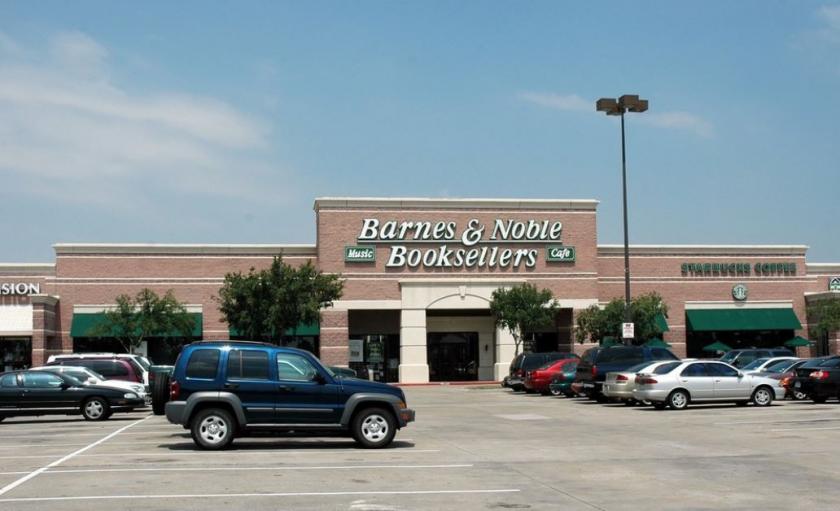
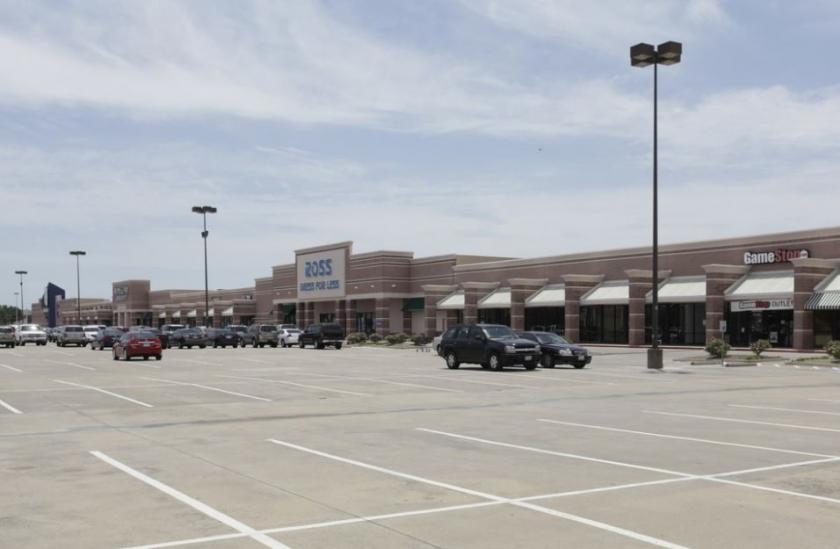
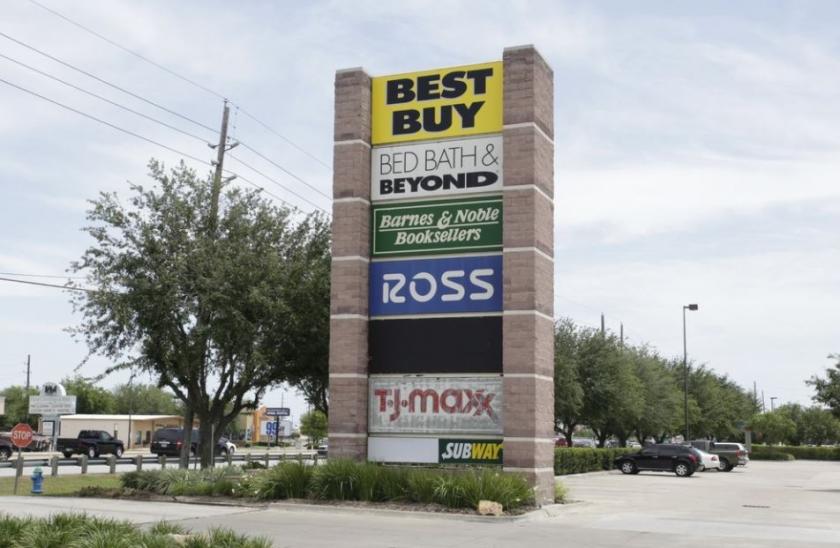
Ideal lineup of A-Class national retailers including: Academy, Best Buy, Five Below and Ross Dress for Less
340,000 population in five mile radius with an average $94,000 income
Junior anchor and inline space opportunities available
12,960 SF junior anchor box ready for immediate occupancy
3,128 SF of inline space available: 75 feet bay depth - will subdivide
No part of this information may be copied, reproduced, repurposed, or screen-captured for any commercial purpose without prior written authorization from MyEListing.
While we strive to provide the most accurate information, all listing information, and demographic data, is provided by third-parties. As such, MyEListing will not be responsible for the accuracy of the information. It is strongly recommended that you verify all information with the listing agent, and any relevant agencies, prior to making any decisions.
What is the asking price for 2306 South Texas 6 in Houston?
The asking price for 2306 South Texas 6 is $18.00 - $21.00 a SF per Year
What is the building size of this commercial Retail property?
The size of this multi-unit property varies between 1874 - 12960 square feet
What kind of Retail is the propery at 2306 South Texas 6?
The property at 2306 South Texas 6 Houston, TX 77077 is listed as a Shopping Center Retail property
What is the population within 1 mile of 2306 South Texas 6 in Houston?
The population within 1 mile of 2306 South Texas 6 Houston, TX 77077 is 12,495 people.
Who do I contact for questions about 2306 South Texas 6?
You should contact the listing agent,
Jason Gaines, for any details regarding this commercial listing.