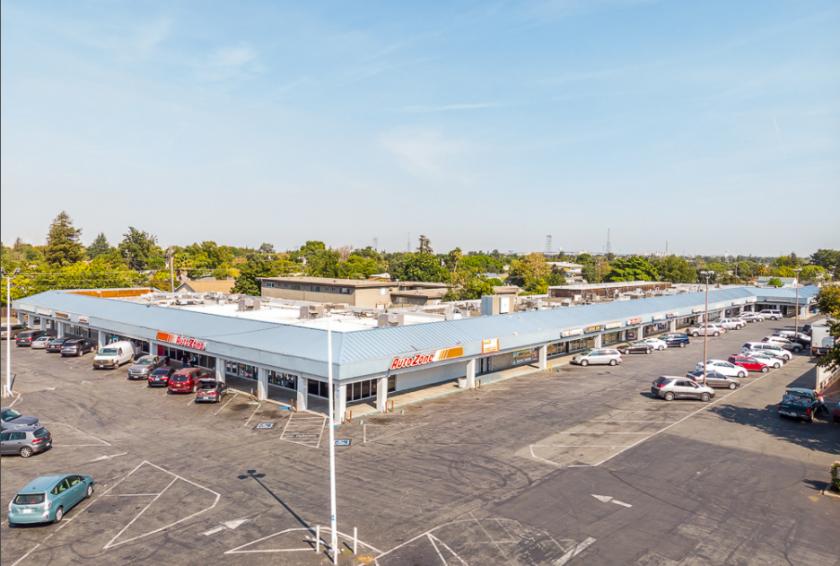
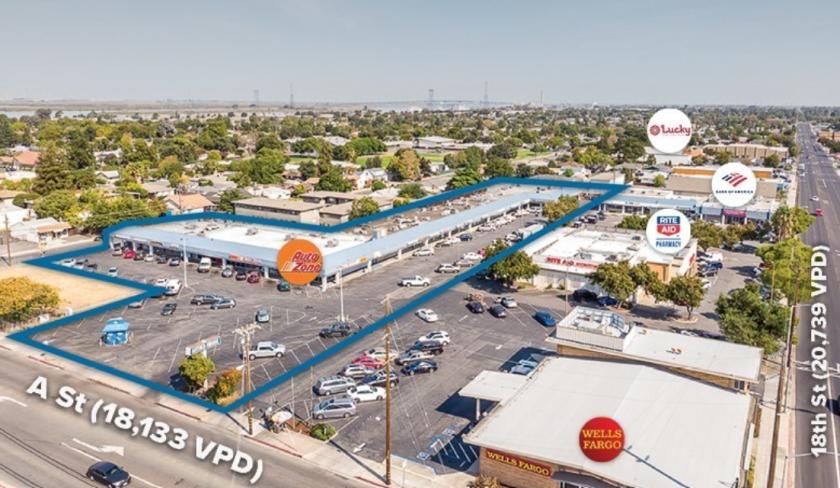
1-Mile | 3-Miles | 5-Miles | ||
---|---|---|---|---|
Total Population | 18,188 | 83,079 | 165,716 | |
Population Median Age | 36 | 37 | 36 | |
Population by Age | 0-9 Yrs | 2538 (13%) | 10653 (12%) | 21668 (13%) |
10-19 Yrs | 2595 (14%) | 12233 (14%) | 24866 (15%) | |
20-29 Yrs | 2633 (14%) | 12101 (14%) | 24013 (14%) | |
30-39 Yrs | 2639 (14%) | 11361 (13%) | 22108 (13%) | |
40-49 Yrs | 2591 (14%) | 10124 (12%) | 21338 (12%) | |
50-59 Yrs | 2215 (12%) | 11727 (14%) | 22557 (13%) | |
60-69 Yrs | 1420 (7%) | 8496 (10%) | 16903 (10%) | |
70+ Yrs | 1558 (8%) | 6384 (7%) | 12263 (7%) | |
Median HH Income | $54,361 | $67,975 | $75,892 | |
Total Household Income | < 24K | 1398 (23%) | 4646 (17%) | 7944 (15%) |
25-49K | 1352 (22%) | 5048 (19%) | 8820 (17%) | |
50-74K | 1336 (22%) | 4720 (17%) | 8486 (16%) | |
75-99K | 821 (13%) | 3610 (13%) | 6720 (13%) | |
100-199K | 890 (14%) | 6536 (24%) | 15170 (29%) | |
200K+ | 250 (4%) | 1721 (6%) | 3840 (7%) | |
Highest Education Level | No Diploma | 2644 | 8123 | 16077 |
Diploma or GED | 3379 | 15598 | 29168 | |
Some College | 3604 | 15999 | 30224 | |
Assoc. Degree | 792 | 4899 | 10557 | |
Bachelors Degree | 936 | 6595 | 15212 | |
Higher Degree | 354 | 2949 | 5973 | |
Total Housing Units | 6,474 | 27,438 | 53,068 | |
--Owner-Occupied | 2,725 | 14,734 | 30,254 | |
--Renter-Occupied | 3,321 | 11,548 | 20,726 | |
Owner-Occupied Values | < 100K | 119 | 547 | 1130 |
100-199K | 197 | 746 | 1191 | |
200-299K | 811 | 2494 | 4233 | |
300-399K | 984 | 4595 | 9067 | |
400-499K | 384 | 3882 | 8333 | |
500K+ | 230 | 2470 | 6301 | |
Total Working Age Population | 14,021 | 64,636 | 128,888 | |
In Work Force | 8,923 | 40,570 | 82,468 | |
Not In Work Force | 5,098 | 24,065 | 46,419 | |
Workforce Employed | 8,181 | 36,631 | 75,845 | |
Workforce Unemployed | 742 | 3,921 | 6,543 | |
Civlian Workforce | 8,923 | 40,552 | 82,388 | |
Military Workforce | 0 | 18 | 80 | |
Total Households | 6,047 | 26,282 | 50,981 | |
Family Households | 4,151 | 19,438 | 38,676 | |
Non-Family Households | 1,896 | 6,843 | 12,305 | |
Married Couple | 2,204 | 12,139 | 25,427 | |
Other Family | 1,947 | 7,299 | 13,249 | |
Married w/Child | 862 | 4,608 | 10,529 | |
Single Male w/Child | 249 | 705 | 1,441 | |
Single Female w/Child | 988 | 3,594 | 5,789 |
Population Change Last Two Decades - Plus Projection
2000 | % | 2010 | % | 2020 | % | 2030 | |
---|---|---|---|---|---|---|---|
California | 33,871,648 | +10 | 37,253,956 | +9 | 40,467,295 | +8 | 43,631,295 |
Contra Costa County | 948,816 | +11 | 1,049,025 | +12 | 1,171,305 | +11 | 1,296,786 |
Sacramento County | 1,223,499 | +16 | 1,418,788 | +11 | 1,572,195 | +12 | 1,758,565 |
Solano County | 394,542 | +5 | 413,344 | +9 | 449,432 | +11 | 499,633 |
Total Working Age Population:
Total Households:
Total Working Age Population:
Total Households:
Total Working Age Population:
Total Households: