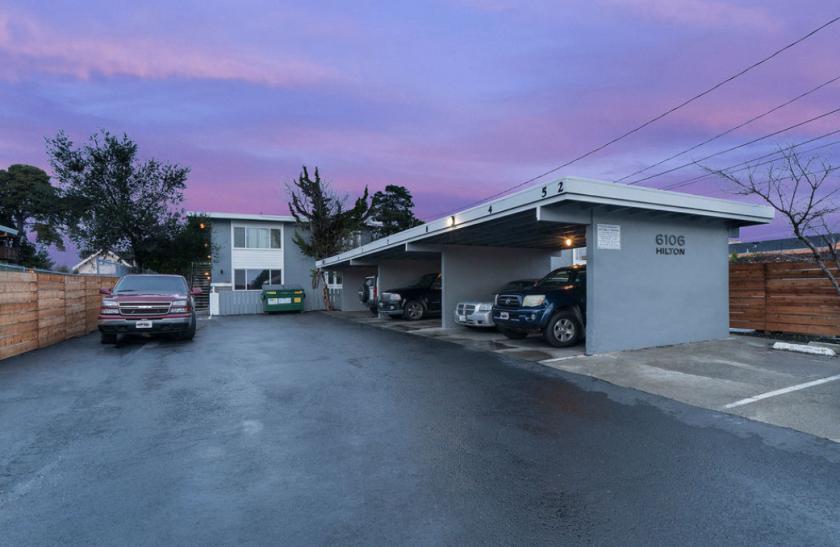
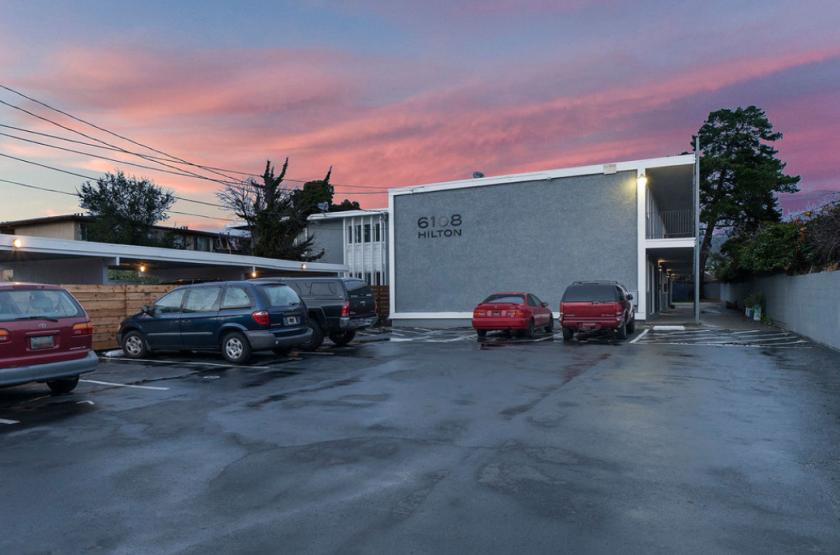
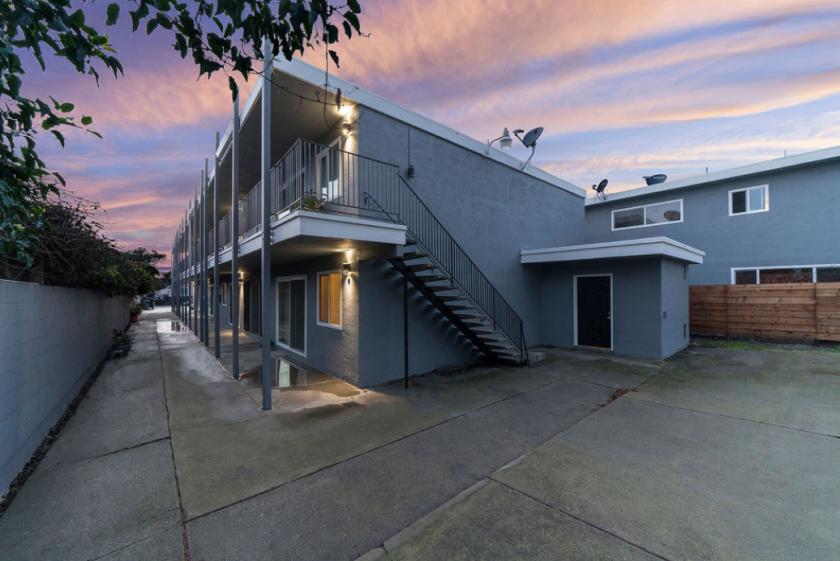
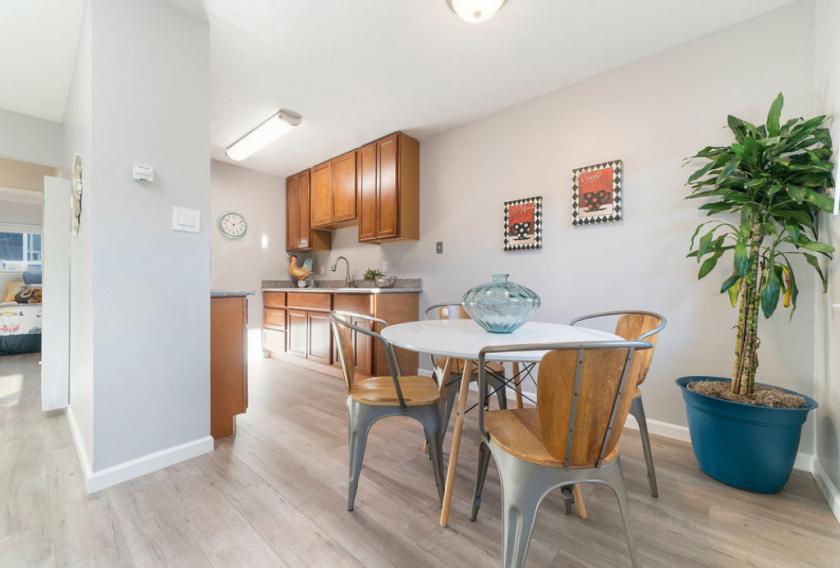
1-Mile | 3-Miles | 5-Miles | ||
---|---|---|---|---|
Total Population | 47,504 | 244,414 | 476,523 | |
Population Median Age | 34 | 36 | 39 | |
Population by Age | 0-9 Yrs | 7486 (15%) | 33102 (13%) | 56002 (11%) |
10-19 Yrs | 6607 (13%) | 32441 (13%) | 52528 (11%) | |
20-29 Yrs | 7229 (15%) | 35599 (14%) | 65482 (13%) | |
30-39 Yrs | 7957 (16%) | 38460 (15%) | 77647 (16%) | |
40-49 Yrs | 6518 (13%) | 34242 (14%) | 68001 (14%) | |
50-59 Yrs | 4842 (10%) | 29410 (12%) | 60160 (12%) | |
60-69 Yrs | 3738 (7%) | 23251 (9%) | 51985 (10%) | |
70+ Yrs | 3127 (6%) | 17907 (7%) | 44717 (9%) | |
Median HH Income | $53,747 | $64,515 | $79,566 | |
Total Household Income | < 24K | 4043 (27%) | 16610 (20%) | 29608 (16%) |
25-49K | 2863 (19%) | 15845 (19%) | 29585 (16%) | |
50-74K | 2204 (15%) | 12518 (15%) | 25423 (14%) | |
75-99K | 1922 (13%) | 9793 (12%) | 20714 (11%) | |
100-199K | 2848 (19%) | 17951 (22%) | 45770 (25%) | |
200K+ | 691 (4%) | 7486 (9%) | 25701 (14%) | |
Highest Education Level | No Diploma | 8623 | 39909 | 58993 |
Diploma or GED | 6713 | 33273 | 55941 | |
Some College | 6160 | 32079 | 60201 | |
Assoc. Degree | 2035 | 9457 | 20273 | |
Bachelors Degree | 4180 | 29498 | 86582 | |
Higher Degree | 2315 | 19352 | 60207 | |
Total Housing Units | 15,710 | 85,494 | 188,080 | |
--Owner-Occupied | 6,383 | 37,249 | 81,806 | |
--Renter-Occupied | 8,188 | 42,954 | 94,996 | |
Owner-Occupied Values | < 100K | 182 | 917 | 1665 |
100-199K | 212 | 1128 | 1554 | |
200-299K | 735 | 2646 | 3864 | |
300-399K | 1328 | 4922 | 7060 | |
400-499K | 1170 | 5100 | 8783 | |
500K+ | 2756 | 22536 | 58880 | |
Total Working Age Population | 35,881 | 191,259 | 387,077 | |
In Work Force | 22,325 | 125,008 | 260,295 | |
Not In Work Force | 13,556 | 66,251 | 126,782 | |
Workforce Employed | 20,700 | 116,440 | 244,967 | |
Workforce Unemployed | 1,610 | 8,402 | 14,599 | |
Civlian Workforce | 22,310 | 124,842 | 259,565 | |
Military Workforce | 15 | 166 | 730 | |
Total Households | 14,572 | 80,203 | 176,802 | |
Family Households | 9,709 | 52,478 | 105,900 | |
Non-Family Households | 4,863 | 27,724 | 70,902 | |
Married Couple | 4,902 | 31,957 | 73,147 | |
Other Family | 4,806 | 20,521 | 32,753 | |
Married w/Child | 2,629 | 15,714 | 32,359 | |
Single Male w/Child | 278 | 1,785 | 3,282 | |
Single Female w/Child | 1,807 | 7,332 | 10,948 |
Population Change Last Two Decades - Plus Projection
2000 | % | 2010 | % | 2020 | % | 2030 | |
---|---|---|---|---|---|---|---|
California | 33,871,648 | +10 | 37,253,956 | +9 | 40,467,295 | +8 | 43,631,295 |
Alameda County | 1,443,741 | +5 | 1,510,271 | +12 | 1,696,752 | +10 | 1,861,027 |
Contra Costa County | 948,816 | +11 | 1,049,025 | +12 | 1,171,305 | +11 | 1,296,786 |
San Francisco County | 776,733 | +4 | 805,235 | +12 | 903,294 | +8 | 976,481 |
San Mateo County | 707,161 | +2 | 718,451 | +9 | 785,650 | +6 | 833,868 |
Total Working Age Population:
Total Households:
Total Working Age Population:
Total Households:
Total Working Age Population:
Total Households: