Industrial Properties
1200 Harbour Way South Richmond, CA 94804
1200 Harbour Way South Richmond, CA 94804
Details & Description
Property Highlights
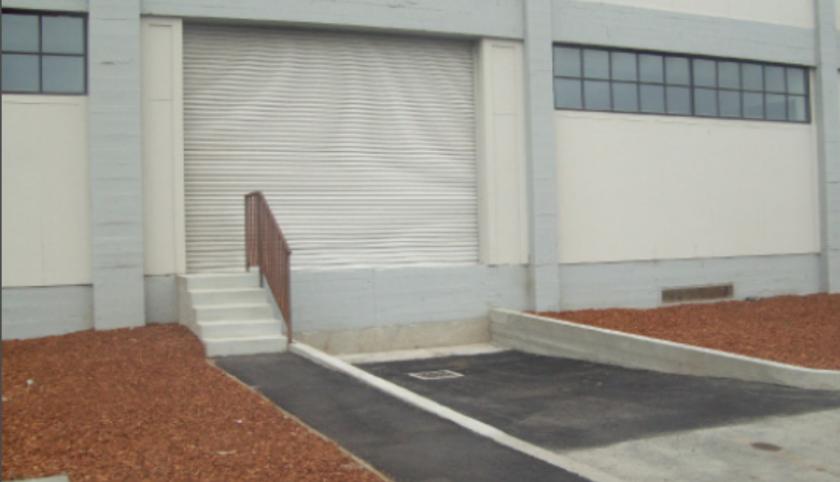
- • One grade-level door
- • AC Transit 74 Line bus stop
- • One loading dock
Listing Agents

Dante Guazzo
O: 510-336-4714
M: 415-308-1285
dguazzo@nainorcal.com
O: 510-336-4714
M: 415-308-1285
dguazzo@nainorcal.com
While we strive to provide the most accurate information, all listing information, and demographic data, is provided by third-parties. As such, MyEListing will not be responsible for the accuracy of the information. It is strongly recommended that you verify all information with the listing agent, and any relevant agencies, prior to making any decisions.