Industrial Properties
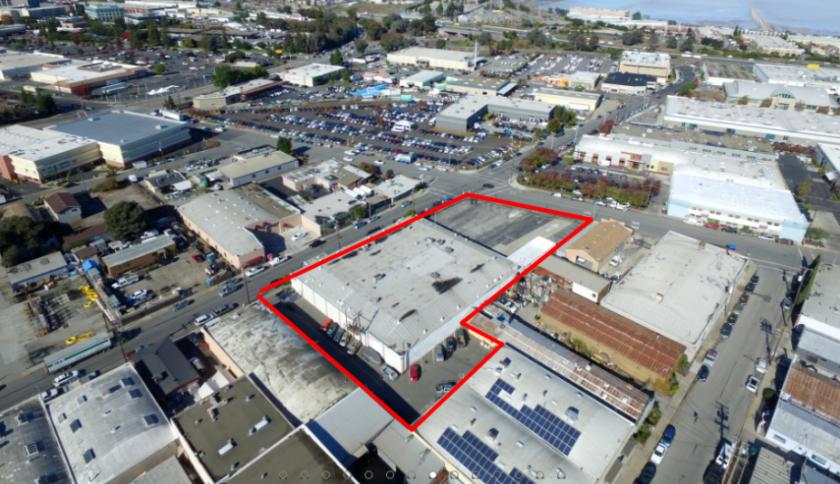
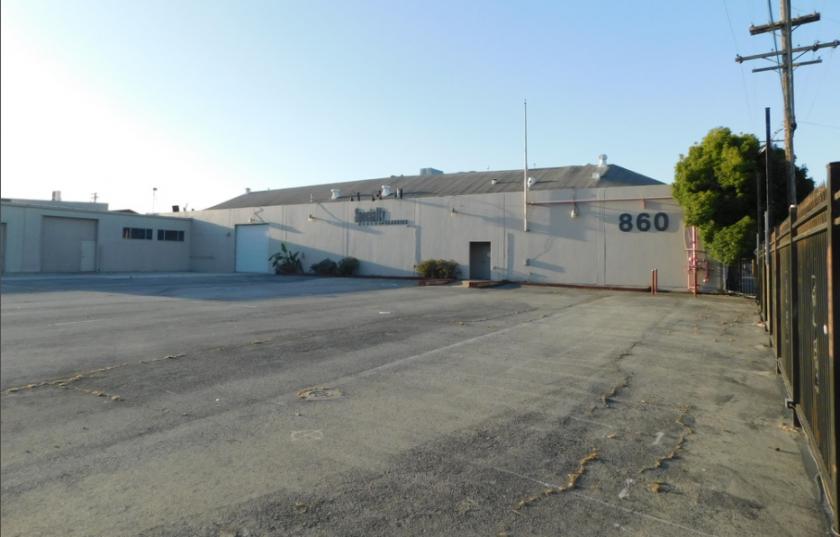
860 Charter Street Redwood City, CA 94063
860 Charter Street Redwood City, CA 94063
Details & Description
Property Highlights
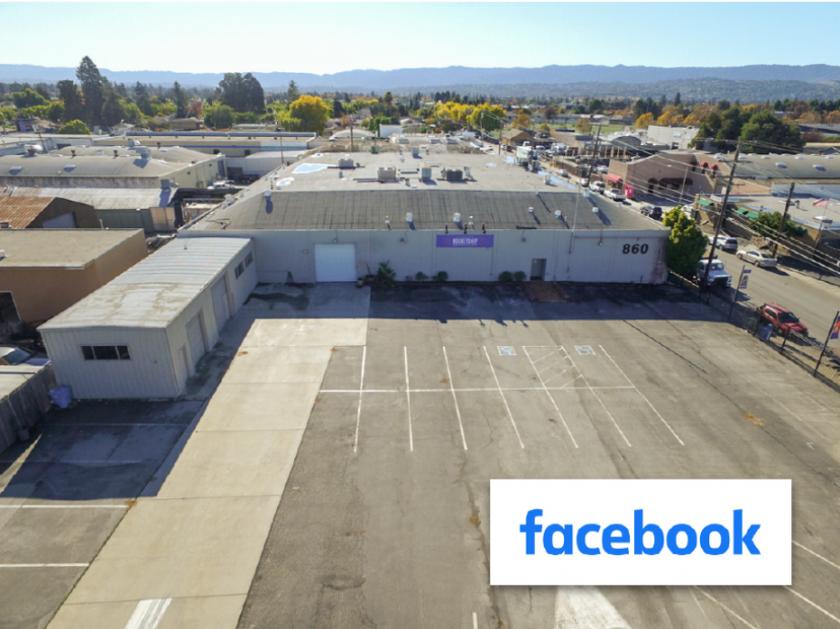
- • Long-term true-NNN lease with Facebook
- • Tenant renovating entire building
- • Opportunity Zone
- • 4 annual rental increases
- • No landlord responsibilities or expenses
Listing Agents

Alexander Barker
O: 415-480-0209
M: 707-480-2591
abarker@nainorcal.com
O: 415-480-0209
M: 707-480-2591
abarker@nainorcal.com
While we strive to provide the most accurate information, all listing information, and demographic data, is provided by third-parties. As such, MyEListing will not be responsible for the accuracy of the information. It is strongly recommended that you verify all information with the listing agent, and any relevant agencies, prior to making any decisions.