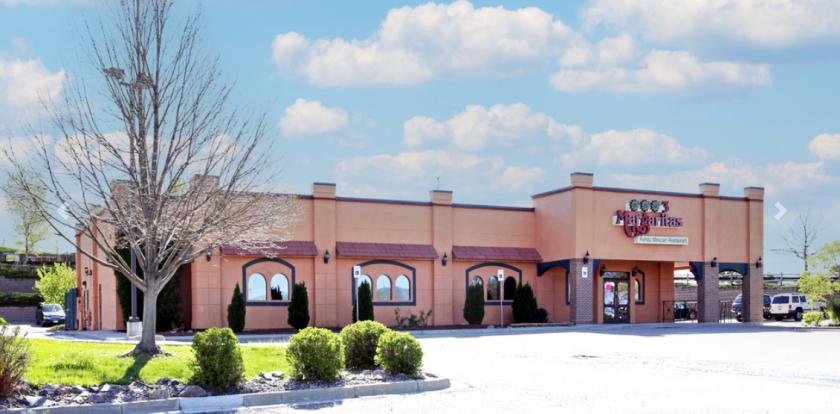
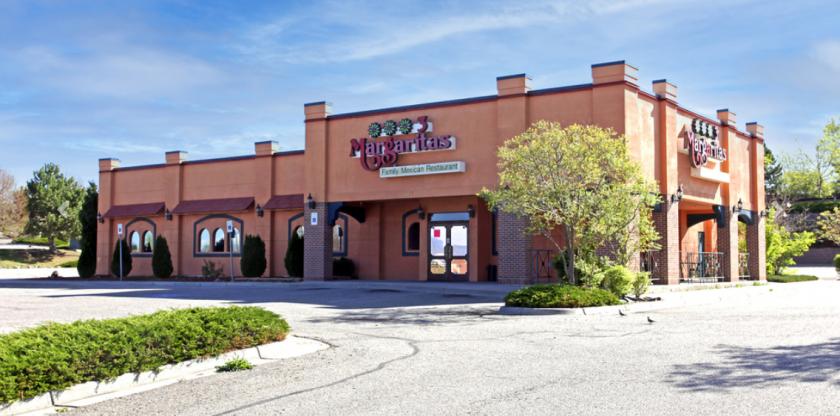
1-Mile | 3-Miles | 5-Miles | ||
---|---|---|---|---|
Total Population | 10,088 | 109,492 | 250,120 | |
Population Median Age | 41 | 40 | 40 | |
Population by Age | 0-9 Yrs | 1083 (10%) | 11735 (10%) | 28171 (11%) |
10-19 Yrs | 1508 (14%) | 15662 (14%) | 34689 (13%) | |
20-29 Yrs | 737 (7%) | 10561 (9%) | 26124 (10%) | |
30-39 Yrs | 1172 (11%) | 13162 (12%) | 31527 (12%) | |
40-49 Yrs | 1603 (15%) | 16302 (14%) | 37086 (14%) | |
50-59 Yrs | 1701 (16%) | 16594 (15%) | 36569 (14%) | |
60-69 Yrs | 1263 (12%) | 14269 (13%) | 30032 (12%) | |
70+ Yrs | 1021 (10%) | 11206 (10%) | 25922 (10%) | |
Median HH Income | $110,691 | $106,758 | $104,782 | |
Total Household Income | < 24K | 274 (7%) | 3007 (7%) | 7639 (7%) |
25-49K | 400 (10%) | 5274 (12%) | 12097 (12%) | |
50-74K | 498 (12%) | 5755 (13%) | 13554 (14%) | |
75-99K | 439 (11%) | 5603 (13%) | 12620 (13%) | |
100-199K | 1656 (42%) | 15823 (37%) | 34529 (35%) | |
200K+ | 603 (15%) | 6847 (16%) | 15868 (16%) | |
Highest Education Level | No Diploma | 124 | 1658 | 4887 |
Diploma or GED | 929 | 9657 | 22924 | |
Some College | 1251 | 13942 | 32699 | |
Assoc. Degree | 511 | 5870 | 12911 | |
Bachelors Degree | 2807 | 28420 | 63643 | |
Higher Degree | 1514 | 17322 | 38036 | |
Total Housing Units | 3,936 | 43,088 | 99,112 | |
--Owner-Occupied | 3,215 | 34,106 | 73,327 | |
--Renter-Occupied | 656 | 8,204 | 22,981 | |
Owner-Occupied Values | < 100K | 95 | 784 | 1133 |
100-199K | 52 | 1048 | 2025 | |
200-299K | 222 | 3414 | 7661 | |
300-399K | 904 | 7547 | 16582 | |
400-499K | 1195 | 10172 | 21220 | |
500K+ | 747 | 11141 | 24706 | |
Total Working Age Population | 8,124 | 87,614 | 199,616 | |
In Work Force | 5,741 | 61,994 | 140,473 | |
Not In Work Force | 2,383 | 25,620 | 59,143 | |
Workforce Employed | 5,485 | 60,089 | 135,918 | |
Workforce Unemployed | 256 | 1,877 | 4,399 | |
Civlian Workforce | 5,741 | 61,966 | 140,318 | |
Military Workforce | 0 | 28 | 156 | |
Total Households | 3,871 | 42,309 | 96,308 | |
Family Households | 2,914 | 30,822 | 68,594 | |
Non-Family Households | 957 | 11,487 | 27,714 | |
Married Couple | 2,534 | 25,831 | 56,977 | |
Other Family | 380 | 4,992 | 11,616 | |
Married w/Child | 1,114 | 10,983 | 24,679 | |
Single Male w/Child | 80 | 851 | 2,143 | |
Single Female w/Child | 174 | 1,678 | 3,896 |
Population Change Last Two Decades - Plus Projection
2000 | % | 2010 | % | 2020 | % | 2030 | |
---|---|---|---|---|---|---|---|
Colorado | 4,301,261 | +17 | 5,029,196 | +16 | 5,838,181 | +15 | 6,733,658 |
Arapahoe County | 487,967 | +17 | 572,003 | +16 | 662,304 | +13 | 750,773 |
Denver County | 554,636 | +8 | 600,158 | +23 | 738,611 | +12 | 827,681 |
Douglas County | 175,766 | +62 | 285,465 | +23 | 350,161 | +16 | 405,087 |
Jefferson County | 527,056 | +1 | 534,543 | +10 | 587,118 | +7 | 626,742 |
Total Working Age Population:
Total Households:
Total Working Age Population:
Total Households:
Total Working Age Population:
Total Households: