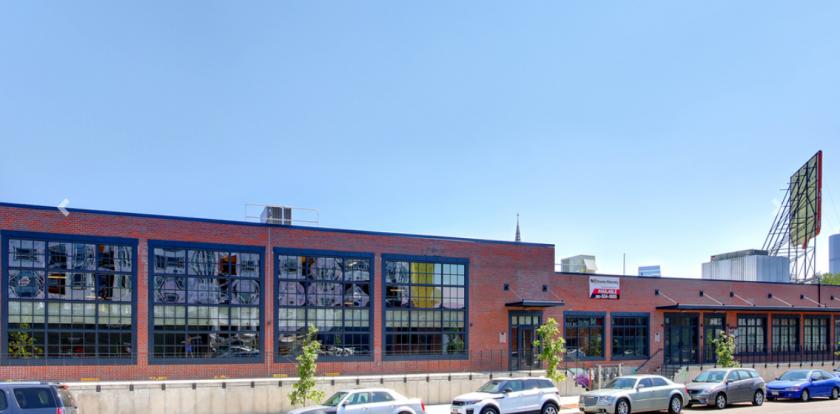
1-Mile | 3-Miles | 5-Miles | ||
---|---|---|---|---|
Total Population | 28,757 | 191,822 | 430,566 | |
Population Median Age | 34 | 37 | 37 | |
Population by Age | 0-9 Yrs | 2307 (8%) | 15701 (8%) | 44295 (10%) |
10-19 Yrs | 1663 (5%) | 13722 (7%) | 38412 (8%) | |
20-29 Yrs | 8579 (29%) | 44663 (23%) | 81524 (18%) | |
30-39 Yrs | 7176 (24%) | 47688 (24%) | 93765 (21%) | |
40-49 Yrs | 3467 (12%) | 23474 (12%) | 57117 (13%) | |
50-59 Yrs | 2916 (10%) | 18914 (9%) | 44914 (10%) | |
60-69 Yrs | 1647 (5%) | 16105 (8%) | 38744 (8%) | |
70+ Yrs | 1003 (3%) | 11555 (6%) | 31795 (7%) | |
Median HH Income | $75,575 | $69,105 | $68,842 | |
Total Household Income | < 24K | 3135 (21%) | 19620 (20%) | 36930 (18%) |
25-49K | 1774 (12%) | 16260 (16%) | 35230 (18%) | |
50-74K | 2269 (15%) | 15606 (16%) | 32299 (16%) | |
75-99K | 1763 (12%) | 11423 (11%) | 22892 (11%) | |
100-199K | 4119 (28%) | 23124 (23%) | 45423 (23%) | |
200K+ | 1376 (9%) | 10376 (10%) | 21761 (11%) | |
Highest Education Level | No Diploma | 2168 | 14178 | 38780 |
Diploma or GED | 2758 | 18983 | 51033 | |
Some College | 3767 | 21824 | 49654 | |
Assoc. Degree | 1034 | 6965 | 15146 | |
Bachelors Degree | 8429 | 54830 | 101761 | |
Higher Degree | 4087 | 33539 | 66136 | |
Total Housing Units | 15,734 | 104,836 | 209,021 | |
--Owner-Occupied | 4,020 | 36,960 | 90,898 | |
--Renter-Occupied | 10,415 | 59,449 | 103,637 | |
Owner-Occupied Values | < 100K | 86 | 835 | 2540 |
100-199K | 115 | 2335 | 7437 | |
200-299K | 485 | 5175 | 14324 | |
300-399K | 763 | 6379 | 16793 | |
400-499K | 912 | 7021 | 14764 | |
500K+ | 1661 | 15216 | 35040 | |
Total Working Age Population | 25,487 | 168,487 | 363,105 | |
In Work Force | 20,120 | 129,804 | 267,524 | |
Not In Work Force | 5,367 | 38,683 | 95,580 | |
Workforce Employed | 19,245 | 124,816 | 256,974 | |
Workforce Unemployed | 872 | 4,950 | 10,365 | |
Civlian Workforce | 20,117 | 129,766 | 267,339 | |
Military Workforce | 3 | 38 | 186 | |
Total Households | 14,435 | 96,409 | 194,535 | |
Family Households | 4,469 | 33,567 | 85,367 | |
Non-Family Households | 9,966 | 62,842 | 109,168 | |
Married Couple | 2,647 | 23,287 | 60,876 | |
Other Family | 1,823 | 10,280 | 24,491 | |
Married w/Child | 722 | 7,401 | 23,854 | |
Single Male w/Child | 268 | 1,513 | 3,311 | |
Single Female w/Child | 639 | 3,505 | 8,431 |
Population Change Last Two Decades - Plus Projection
2000 | % | 2010 | % | 2020 | % | 2030 | |
---|---|---|---|---|---|---|---|
Colorado | 4,301,261 | +17 | 5,029,196 | +16 | 5,838,181 | +15 | 6,733,658 |
Adams County | 363,857 | +21 | 441,603 | +20 | 530,680 | +21 | 642,318 |
Arapahoe County | 487,967 | +17 | 572,003 | +16 | 662,304 | +13 | 750,773 |
Denver County | 554,636 | +8 | 600,158 | +23 | 738,611 | +12 | 827,681 |
Jefferson County | 527,056 | +1 | 534,543 | +10 | 587,118 | +7 | 626,742 |
Total Working Age Population:
Total Households:
Total Working Age Population:
Total Households:
Total Working Age Population:
Total Households: