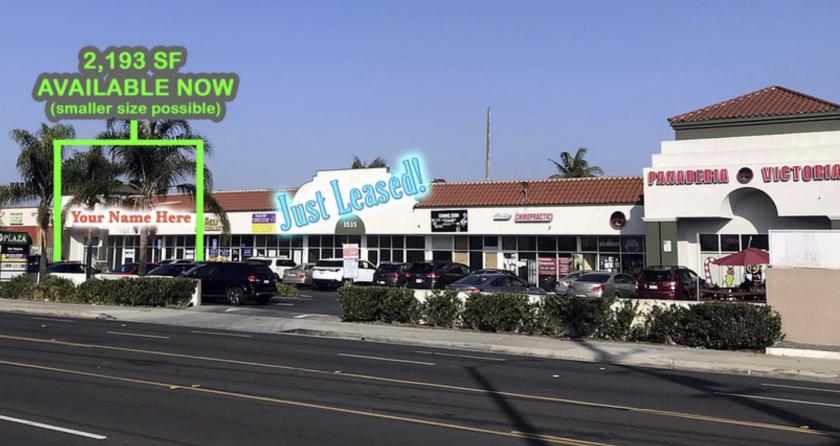
Retail Space
3535 West Imperial Highway Inglewood, CA 90303
3535 West Imperial Highway Inglewood, CA 90303
Details & Description
Property Highlights
- • Great Parking Ratio at 4.31,000 SF
- • Excellent Signage Opportunities
- • Built in 1996 with Recent Remodeling
- • Easy Drive-InDrive-Out Access
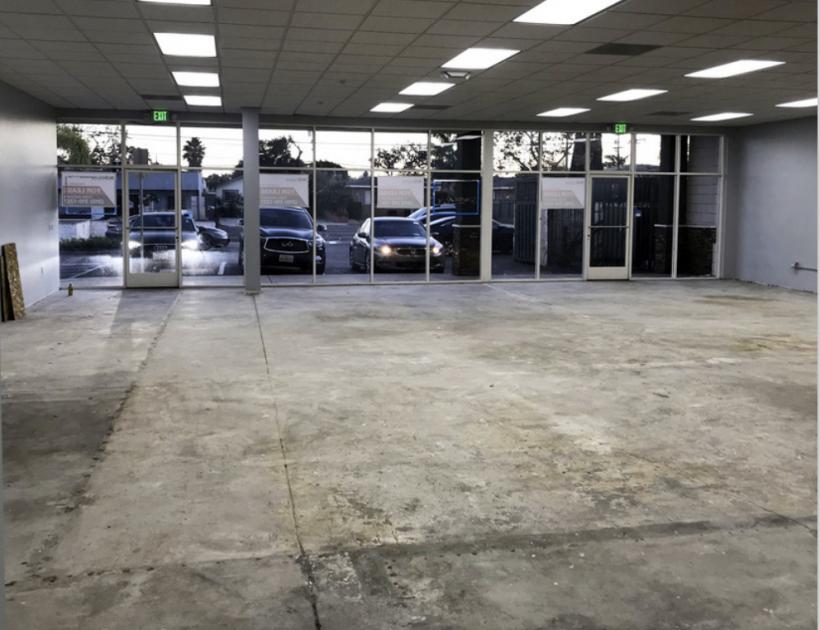
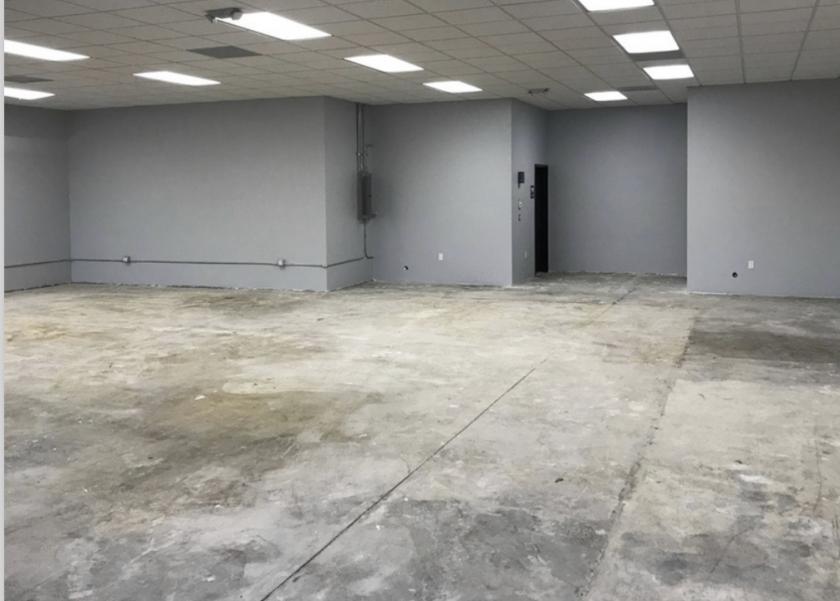
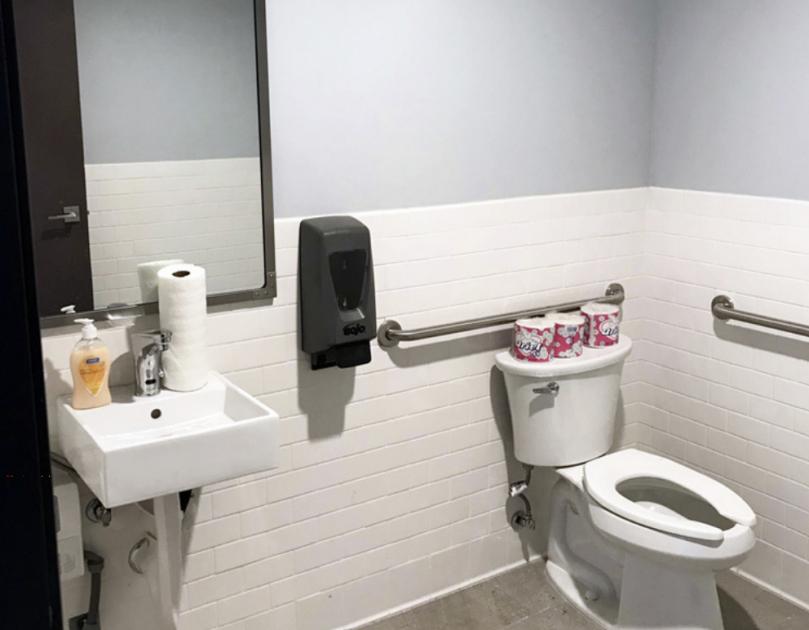
Additional Photos
Listing Agents

Todd Rizzardi
O: 818-815-2422
trizzardi@naicapital.com
O: 818-815-2422
trizzardi@naicapital.com
While we strive to provide the most accurate information, all listing information, and demographic data, is provided by third-parties. As such, MyEListing will not be responsible for the accuracy of the information. It is strongly recommended that you verify all information with the listing agent, and any relevant agencies, prior to making any decisions.


