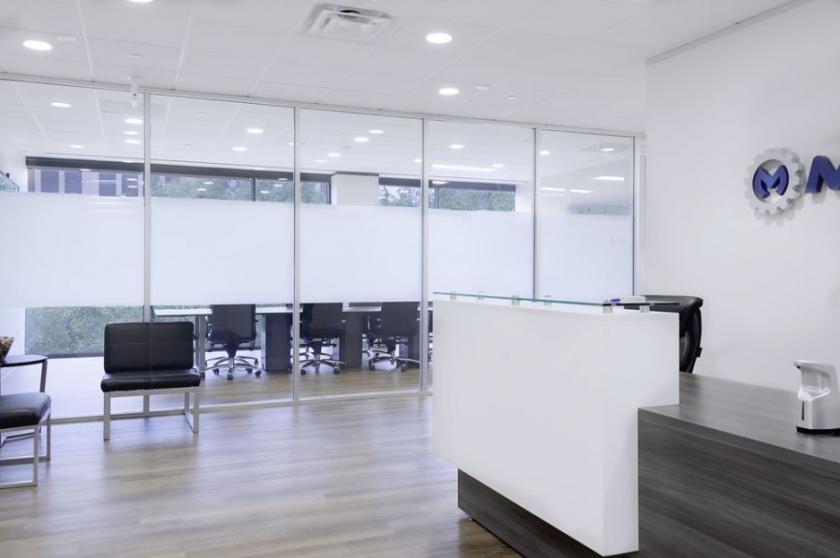
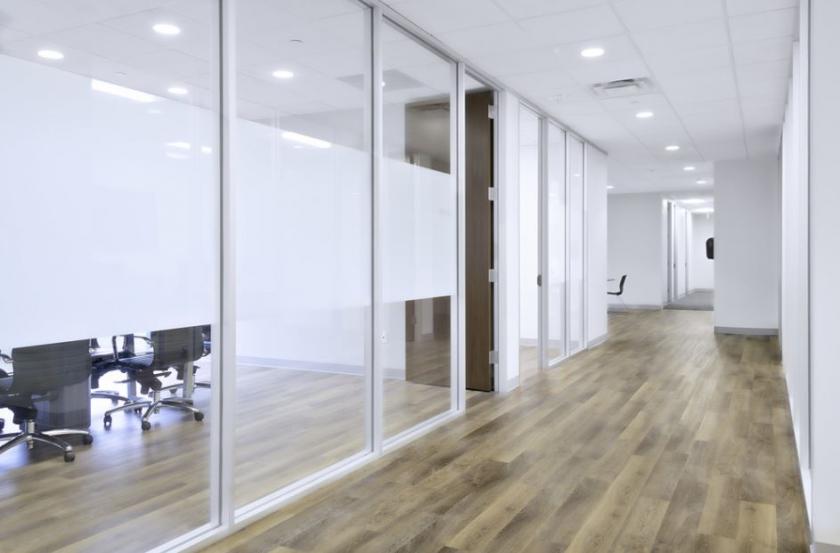
1-Mile | 3-Miles | 5-Miles | ||
---|---|---|---|---|
Total Population | 24,737 | 182,264 | 505,073 | |
Population Median Age | 42 | 36 | 36 | |
Population by Age | 0-9 Yrs | 2327 (9%) | 24937 (13%) | 67334 (13%) |
10-19 Yrs | 1144 (4%) | 16995 (9%) | 51160 (10%) | |
20-29 Yrs | 4220 (17%) | 32490 (17%) | 86367 (17%) | |
30-39 Yrs | 4768 (19%) | 34641 (19%) | 93348 (18%) | |
40-49 Yrs | 3330 (13%) | 23257 (12%) | 66489 (13%) | |
50-59 Yrs | 3109 (12%) | 19264 (10%) | 56094 (11%) | |
60-69 Yrs | 2784 (11%) | 15458 (8%) | 45844 (9%) | |
70+ Yrs | 3056 (12%) | 15222 (8%) | 38437 (7%) | |
Median HH Income | $97,806 | $69,606 | $71,805 | |
Total Household Income | < 24K | 1424 (10%) | 15651 (19%) | 39749 (18%) |
25-49K | 1830 (13%) | 15669 (19%) | 40789 (18%) | |
50-74K | 1835 (13%) | 11853 (14%) | 30658 (14%) | |
75-99K | 1679 (12%) | 8692 (10%) | 21419 (9%) | |
100-199K | 3724 (28%) | 15308 (18%) | 41899 (19%) | |
200K+ | 2749 (20%) | 14765 (18%) | 41041 (19%) | |
Highest Education Level | No Diploma | 482 | 14785 | 45021 |
Diploma or GED | 1316 | 15792 | 47609 | |
Some College | 2484 | 17636 | 45777 | |
Assoc. Degree | 906 | 6259 | 16418 | |
Bachelors Degree | 8921 | 42571 | 109452 | |
Higher Degree | 6149 | 31515 | 89829 | |
Total Housing Units | 15,821 | 94,445 | 244,939 | |
--Owner-Occupied | 5,432 | 26,784 | 86,576 | |
--Renter-Occupied | 7,810 | 55,154 | 128,979 | |
Owner-Occupied Values | < 100K | 190 | 1235 | 5716 |
100-199K | 927 | 3122 | 9784 | |
200-299K | 1088 | 2798 | 8942 | |
300-399K | 616 | 2238 | 10899 | |
400-499K | 346 | 1717 | 8828 | |
500K+ | 2266 | 15674 | 42406 | |
Total Working Age Population | 21,591 | 146,374 | 405,239 | |
In Work Force | 15,859 | 105,123 | 289,596 | |
Not In Work Force | 5,732 | 41,251 | 115,643 | |
Workforce Employed | 15,272 | 101,437 | 278,371 | |
Workforce Unemployed | 587 | 3,661 | 11,094 | |
Civlian Workforce | 15,859 | 105,097 | 289,466 | |
Military Workforce | 0 | 26 | 130 | |
Total Households | 13,242 | 81,938 | 215,555 | |
Family Households | 5,585 | 41,748 | 116,514 | |
Non-Family Households | 7,657 | 40,190 | 99,041 | |
Married Couple | 4,783 | 31,557 | 87,545 | |
Other Family | 802 | 10,191 | 28,968 | |
Married w/Child | 1,689 | 14,122 | 38,537 | |
Single Male w/Child | 103 | 1,378 | 4,125 | |
Single Female w/Child | 185 | 3,859 | 11,202 |
Population Change Last Two Decades - Plus Projection
2000 | % | 2010 | % | 2020 | % | 2030 | |
---|---|---|---|---|---|---|---|
Texas | 20,851,820 | +21 | 25,145,561 | +18 | 29,677,668 | +18 | 34,894,452 |
Fort Bend County | 354,452 | +65 | 585,375 | +44 | 840,383 | +43 | 1,203,029 |
Harris County | 3,400,578 | +20 | 4,092,459 | +22 | 4,978,845 | +19 | 5,924,750 |
Total Working Age Population:
Total Households:
Total Working Age Population:
Total Households:
Total Working Age Population:
Total Households: