Retail Space
1795 Long Beach Boulevard Long Beach, CA 90813
1795 Long Beach Boulevard Long Beach, CA 90813
Details & Description
Property Highlights
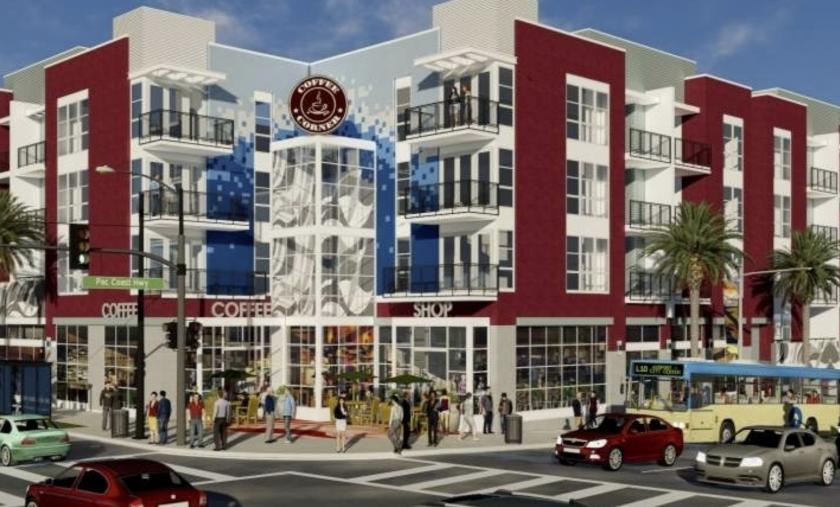
• Seeking Cafes, Services, Community stores for this very busy interaction
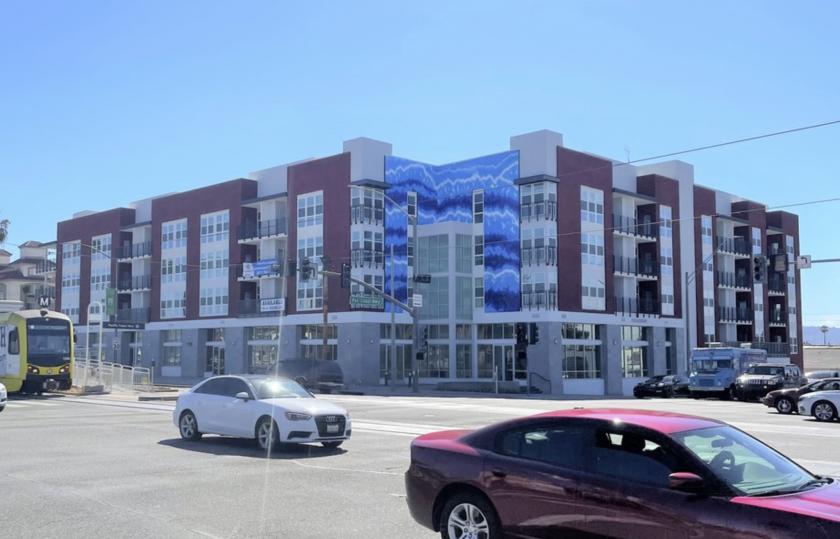
• New Mixed Use Building - Retail Space Available
Listing Agents

Patrick Ortiz
O: 818-905-2400
portiz@naicapital.com
O: 818-905-2400
portiz@naicapital.com

Jesse Paster
O: 818-905-2400
M: 213-458-1974
jpaster@naicapital.com
O: 818-905-2400
M: 213-458-1974
jpaster@naicapital.com
While we strive to provide the most accurate information, all listing information, and demographic data, is provided by third-parties. As such, MyEListing will not be responsible for the accuracy of the information. It is strongly recommended that you verify all information with the listing agent, and any relevant agencies, prior to making any decisions.