Specialty Real Estate
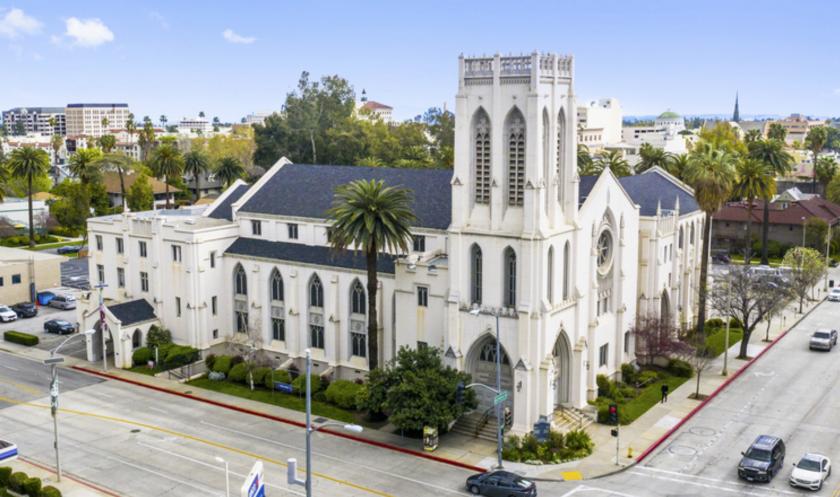
464 East Walnut Street Pasadena, CA 91101
464 East Walnut Street Pasadena, CA 91101
Details & Description
Property Highlights
• Excellent location with projected 2024 average household income $142,827
• Close to an abundance of Pasadena lifestyle amenities
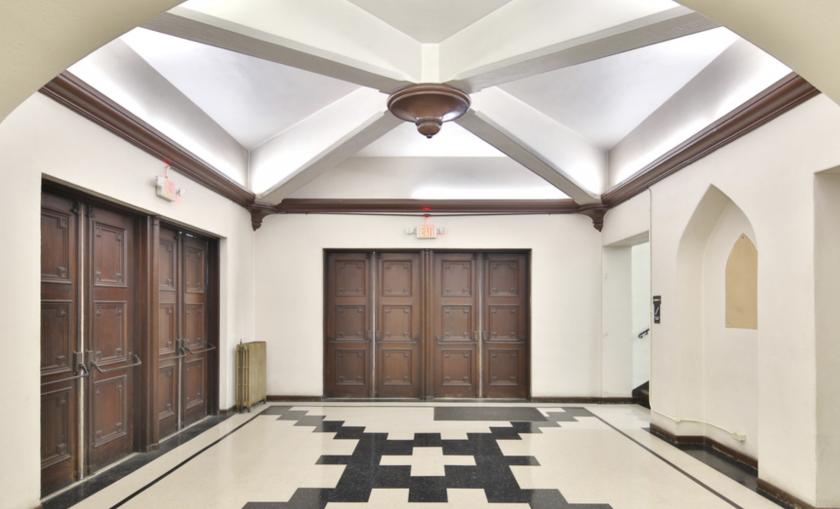
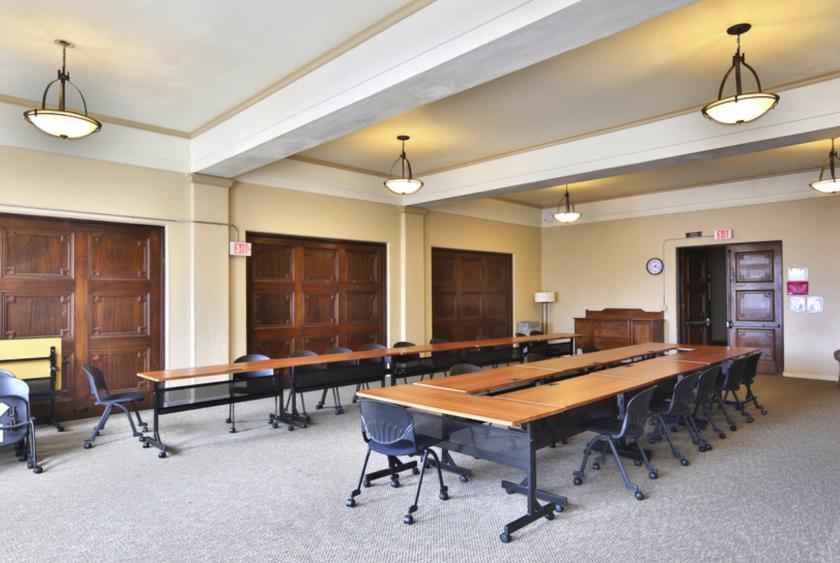
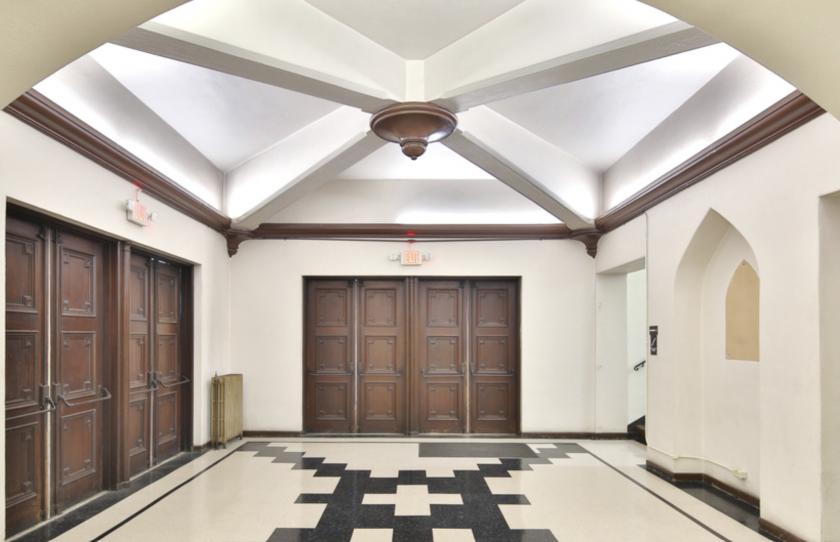
Additional Photos

Listing Agents

Myron Sokolsky
O: 818-742-1613
M: 310-503-5419
msokolsky@naicapital.com
O: 818-742-1613
M: 310-503-5419
msokolsky@naicapital.com

Stephanie Repetto
O: 818-815-2413
M: 714-458-5050
srepetto@naicapital.com
O: 818-815-2413
M: 714-458-5050
srepetto@naicapital.com
While we strive to provide the most accurate information, all listing information, and demographic data, is provided by third-parties. As such, MyEListing will not be responsible for the accuracy of the information. It is strongly recommended that you verify all information with the listing agent, and any relevant agencies, prior to making any decisions.


