Commercial Land
5805 South Sam Houston Parkway East Houston, TX 77048
5805 South Sam Houston Parkway East Houston, TX 77048
Details & Description
Property Highlights
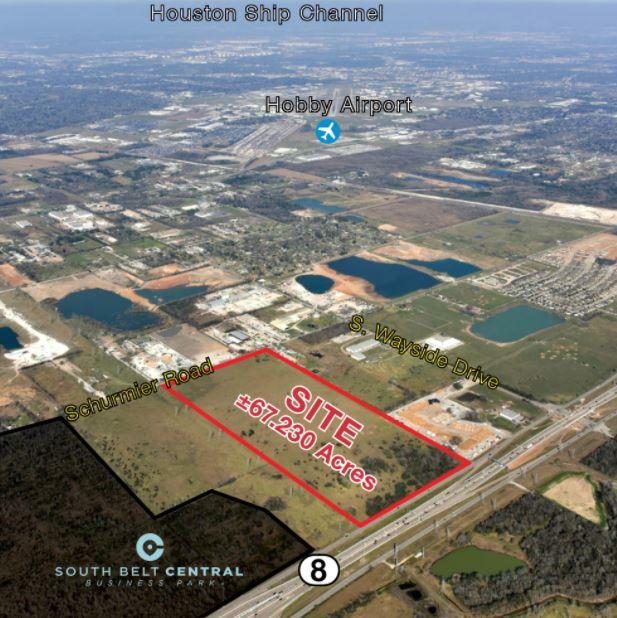
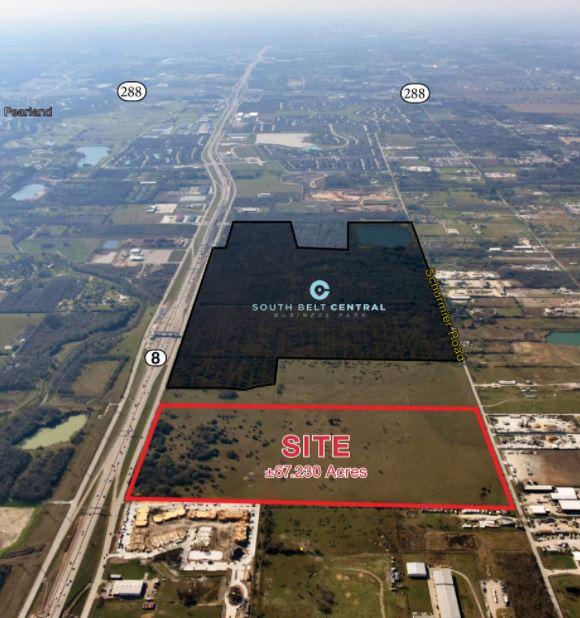
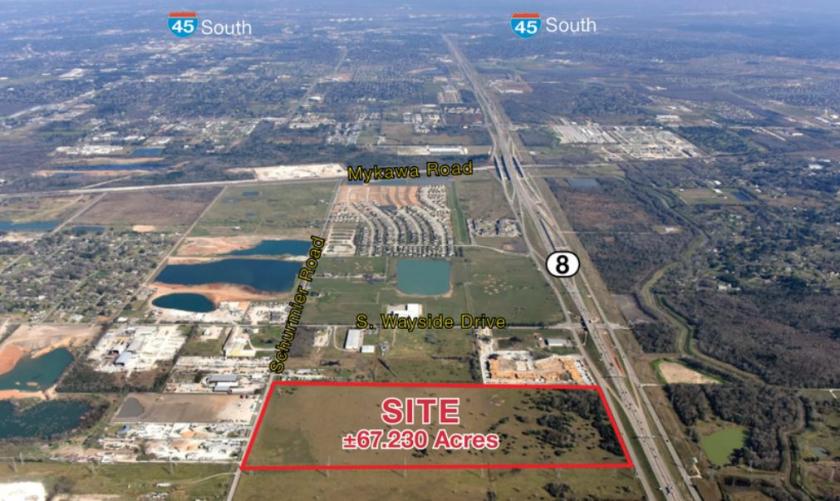
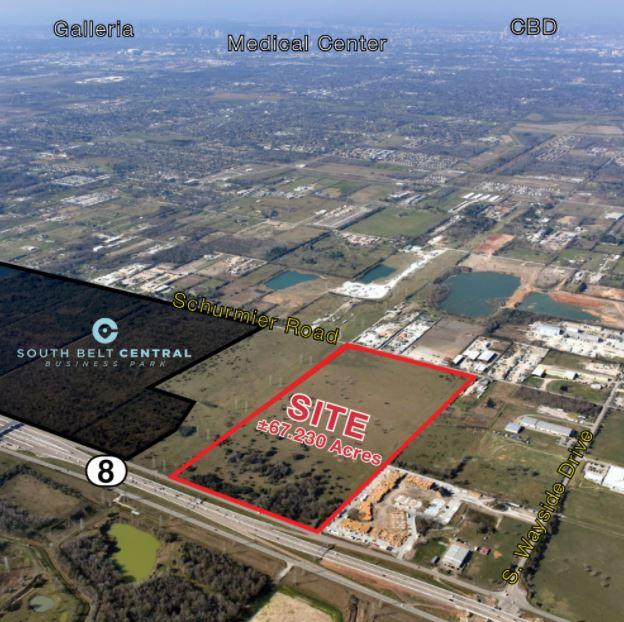
- • 991 Frontage Along Beltway 8
- • City of Houston Utilities
- • Onsite Storm-Water Detention Required
- • Onsite Storm-Water Detention Required
- • Over 100,000 Vehicles Pass Along Beltway Daily
- • Minimal Floodplain Impact Less Than 1 in 100-Year
Additional Photos
Listing Agents

Clay Pritchett
O: 713-985-4631
clay.pritchett@naipartners.com
O: 713-985-4631
clay.pritchett@naipartners.com

Zane Carman
O: 713-985-4418
M: 409-789-9029
zane.carman@partnersrealestate.com
O: 713-985-4418
M: 409-789-9029
zane.carman@partnersrealestate.com
While we strive to provide the most accurate information, all listing information, and demographic data, is provided by third-parties. As such, MyEListing will not be responsible for the accuracy of the information. It is strongly recommended that you verify all information with the listing agent, and any relevant agencies, prior to making any decisions.


