Retail Space
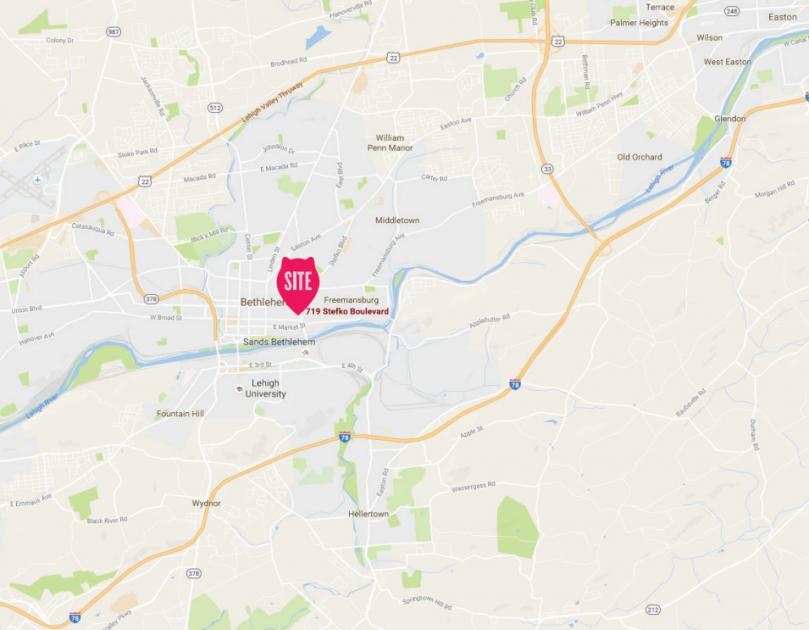
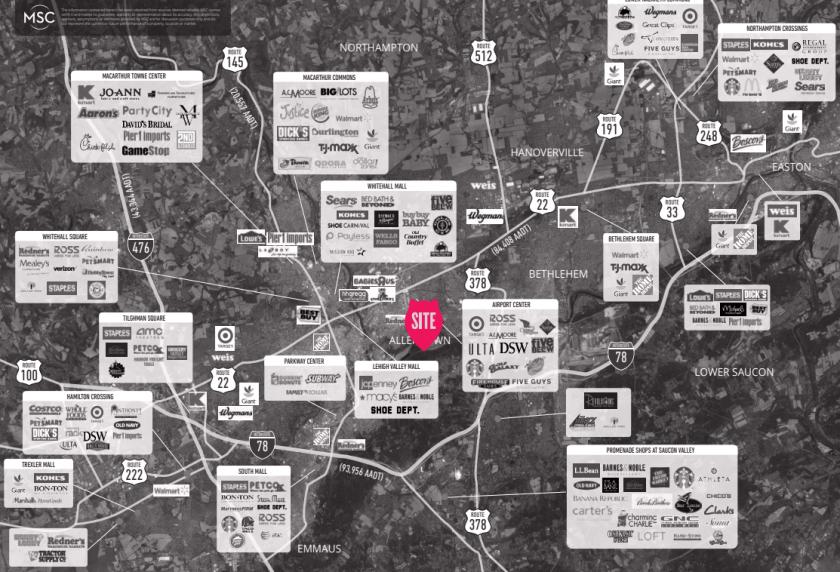
719 Stefko Boulevard Bethlehem, PA 18017
719 Stefko Boulevard Bethlehem, PA 18017
Details & Description
Property Highlights
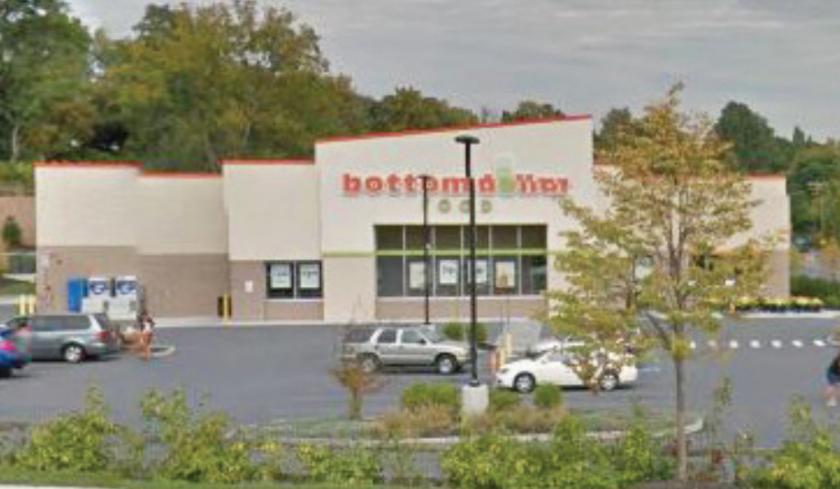
• Well positioned along Stefko Blvd next to a recently constructed Wawa with gas
• 18,029 SF freestanding building for sublease
Listing Agents

Scott Weiss
O: 215-883-7396
sweiss@hellomsc.com
O: 215-883-7396
sweiss@hellomsc.com

Leah Sweitzer
MSC
O: 310-622-4532
lsweitzer@hellomsc.com
MSC
O: 310-622-4532
lsweitzer@hellomsc.com

Jason Bock
O: 215-883-7403
jbock@hellomsc.com
O: 215-883-7403
jbock@hellomsc.com
While we strive to provide the most accurate information, all listing information, and demographic data, is provided by third-parties. As such, MyEListing will not be responsible for the accuracy of the information. It is strongly recommended that you verify all information with the listing agent, and any relevant agencies, prior to making any decisions.