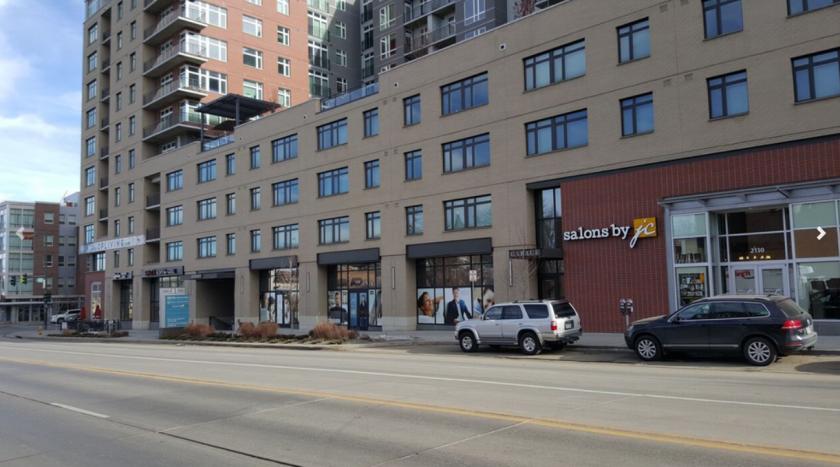
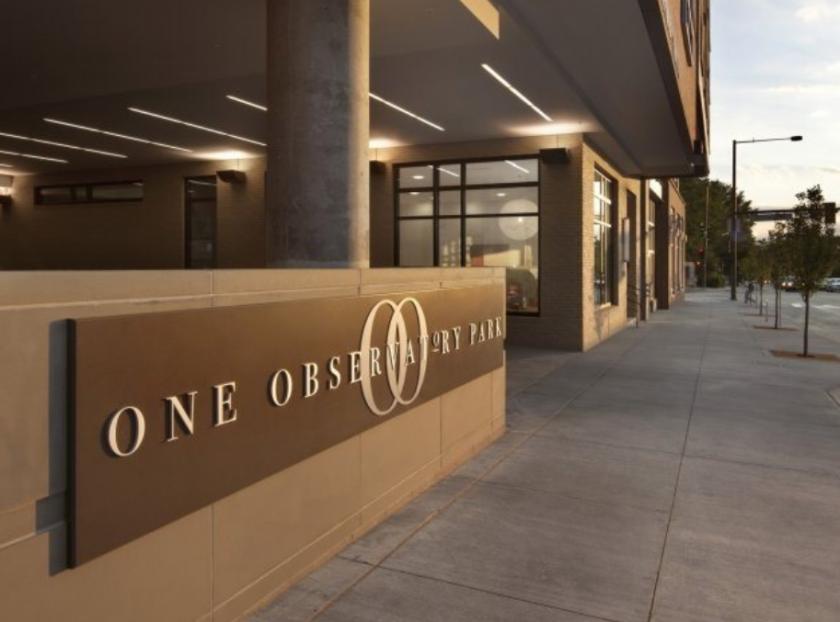
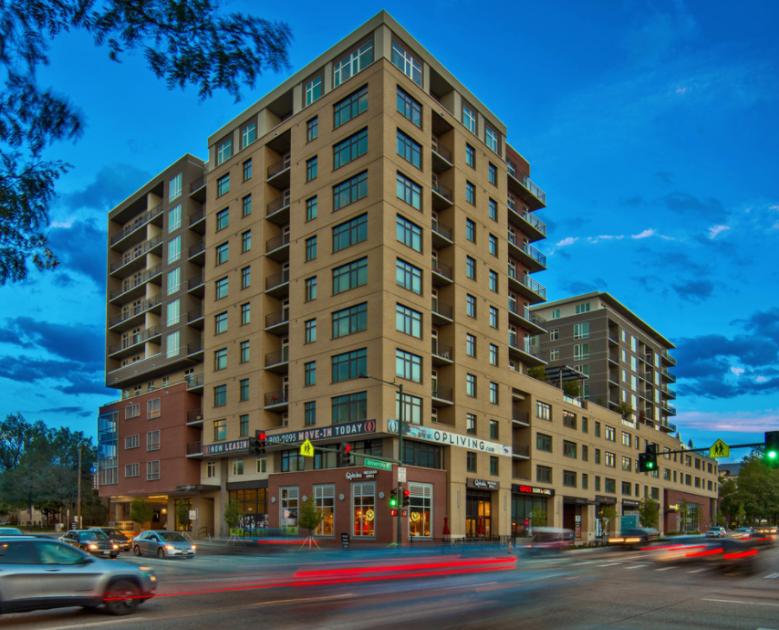
1-Mile | 3-Miles | 5-Miles | ||
---|---|---|---|---|
Total Population | 21,162 | 151,324 | 469,666 | |
Population Median Age | 35 | 39 | 38 | |
Population by Age | 0-9 Yrs | 1780 (8%) | 14341 (9%) | 50146 (10%) |
10-19 Yrs | 3222 (15%) | 12768 (8%) | 41616 (8%) | |
20-29 Yrs | 5202 (24%) | 28822 (19%) | 88817 (18%) | |
30-39 Yrs | 3364 (15%) | 29394 (19%) | 90158 (19%) | |
40-49 Yrs | 2602 (12%) | 19173 (12%) | 58716 (12%) | |
50-59 Yrs | 1627 (7%) | 16496 (10%) | 51920 (11%) | |
60-69 Yrs | 1835 (8%) | 16039 (10%) | 47245 (10%) | |
70+ Yrs | 1531 (7%) | 14290 (9%) | 41048 (8%) | |
Median HH Income | $78,011 | $73,720 | $65,831 | |
Total Household Income | < 24K | 1241 (14%) | 10324 (14%) | 37740 (17%) |
25-49K | 1630 (19%) | 13814 (19%) | 44382 (20%) | |
50-74K | 1323 (15%) | 11715 (16%) | 38112 (17%) | |
75-99K | 766 (8%) | 8085 (11%) | 26237 (12%) | |
100-199K | 2093 (24%) | 17293 (24%) | 46792 (21%) | |
200K+ | 1520 (17%) | 9463 (13%) | 22041 (10%) | |
Highest Education Level | No Diploma | 227 | 6391 | 30925 |
Diploma or GED | 1044 | 15205 | 55706 | |
Some College | 2078 | 18054 | 56587 | |
Assoc. Degree | 595 | 6146 | 19850 | |
Bachelors Degree | 5190 | 41103 | 112111 | |
Higher Degree | 4142 | 26872 | 72484 | |
Total Housing Units | 9,591 | 76,568 | 230,593 | |
--Owner-Occupied | 4,539 | 35,261 | 98,954 | |
--Renter-Occupied | 4,035 | 35,432 | 116,349 | |
Owner-Occupied Values | < 100K | 57 | 886 | 3381 |
100-199K | 61 | 2176 | 10749 | |
200-299K | 257 | 4306 | 18109 | |
300-399K | 530 | 5463 | 17159 | |
400-499K | 780 | 5935 | 14200 | |
500K+ | 2854 | 16496 | 35357 | |
Total Working Age Population | 18,463 | 129,882 | 394,328 | |
In Work Force | 12,855 | 95,133 | 285,560 | |
Not In Work Force | 5,608 | 34,750 | 108,768 | |
Workforce Employed | 12,211 | 91,099 | 274,414 | |
Workforce Unemployed | 633 | 3,983 | 10,882 | |
Civlian Workforce | 12,844 | 95,082 | 285,295 | |
Military Workforce | 11 | 51 | 264 | |
Total Households | 8,574 | 70,693 | 215,303 | |
Family Households | 3,924 | 31,975 | 96,689 | |
Non-Family Households | 4,649 | 38,718 | 118,614 | |
Married Couple | 3,177 | 24,614 | 70,726 | |
Other Family | 747 | 7,361 | 25,963 | |
Married w/Child | 1,415 | 9,643 | 28,881 | |
Single Male w/Child | 169 | 1,205 | 3,743 | |
Single Female w/Child | 264 | 2,185 | 9,284 |
Population Change Last Two Decades - Plus Projection
2000 | % | 2010 | % | 2020 | % | 2030 | |
---|---|---|---|---|---|---|---|
Colorado | 4,301,261 | +17 | 5,029,196 | +16 | 5,838,181 | +15 | 6,733,658 |
Adams County | 363,857 | +21 | 441,603 | +20 | 530,680 | +21 | 642,318 |
Arapahoe County | 487,967 | +17 | 572,003 | +16 | 662,304 | +13 | 750,773 |
Denver County | 554,636 | +8 | 600,158 | +23 | 738,611 | +12 | 827,681 |
Jefferson County | 527,056 | +1 | 534,543 | +10 | 587,118 | +7 | 626,742 |
Total Working Age Population:
Total Households:
Total Working Age Population:
Total Households:
Total Working Age Population:
Total Households: