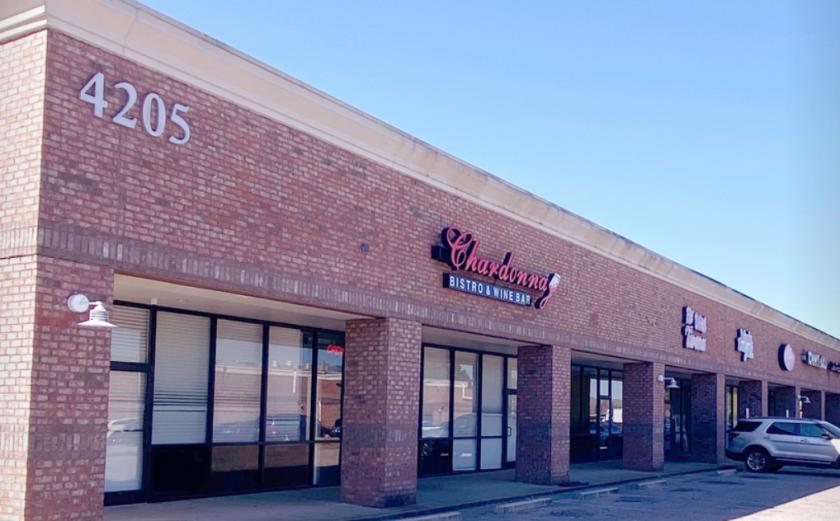
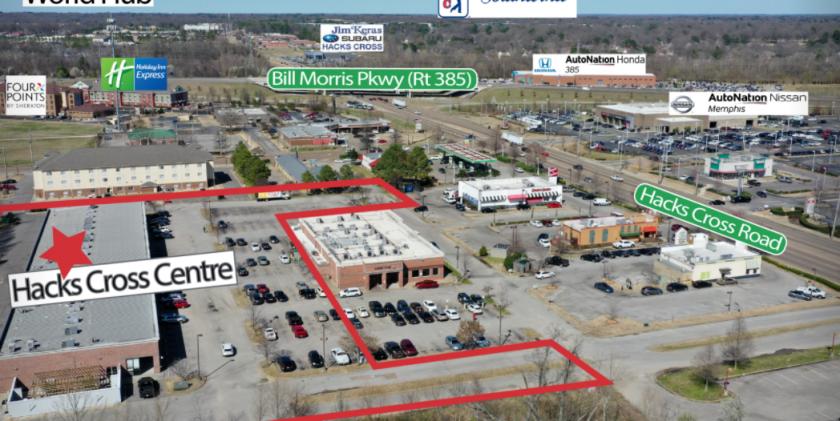
1-Mile | 3-Miles | 5-Miles | ||
---|---|---|---|---|
Total Population | 8,676 | 69,739 | 162,486 | |
Population Median Age | 39 | 36 | 36 | |
Population by Age | 0-9 Yrs | 778 (8%) | 8884 (12%) | 22171 (13%) |
10-19 Yrs | 1221 (14%) | 9999 (14%) | 23182 (14%) | |
20-29 Yrs | 1346 (15%) | 9993 (14%) | 23399 (14%) | |
30-39 Yrs | 912 (10%) | 10211 (14%) | 22270 (13%) | |
40-49 Yrs | 1455 (16%) | 9998 (14%) | 22354 (13%) | |
50-59 Yrs | 1380 (15%) | 9101 (13%) | 19844 (12%) | |
60-69 Yrs | 1019 (11%) | 7378 (10%) | 16790 (10%) | |
70+ Yrs | 566 (6%) | 4176 (5%) | 12477 (7%) | |
Median HH Income | $73,401 | $62,068 | $63,121 | |
Total Household Income | < 24K | 268 (8%) | 3123 (12%) | 9807 (15%) |
25-49K | 609 (20%) | 7015 (27%) | 14890 (24%) | |
50-74K | 668 (22%) | 5479 (21%) | 11025 (17%) | |
75-99K | 475 (15%) | 3208 (12%) | 7428 (12%) | |
100-199K | 900 (29%) | 5798 (22%) | 13725 (22%) | |
200K+ | 82 (2%) | 1252 (4%) | 4510 (7%) | |
Highest Education Level | No Diploma | 399 | 3544 | 7456 |
Diploma or GED | 1496 | 11480 | 24866 | |
Some College | 1588 | 11727 | 25897 | |
Assoc. Degree | 501 | 3405 | 6850 | |
Bachelors Degree | 1187 | 9635 | 24742 | |
Higher Degree | 817 | 6627 | 16813 | |
Total Housing Units | 3,154 | 27,555 | 66,733 | |
--Owner-Occupied | 1,970 | 14,111 | 34,156 | |
--Renter-Occupied | 1,032 | 11,763 | 27,228 | |
Owner-Occupied Values | < 100K | 206 | 2150 | 5533 |
100-199K | 1372 | 7539 | 12845 | |
200-299K | 311 | 2394 | 6513 | |
300-399K | 71 | 1073 | 4488 | |
400-499K | 2 | 304 | 1821 | |
500K+ | 8 | 650 | 2955 | |
Total Working Age Population | 7,192 | 54,417 | 125,225 | |
In Work Force | 5,420 | 39,631 | 88,023 | |
Not In Work Force | 1,772 | 14,785 | 37,202 | |
Workforce Employed | 5,187 | 37,494 | 83,347 | |
Workforce Unemployed | 220 | 2,030 | 4,508 | |
Civlian Workforce | 5,407 | 39,524 | 87,855 | |
Military Workforce | 13 | 107 | 167 | |
Total Households | 3,003 | 25,874 | 61,384 | |
Family Households | 2,135 | 16,965 | 40,097 | |
Non-Family Households | 868 | 8,909 | 21,287 | |
Married Couple | 1,583 | 11,063 | 26,693 | |
Other Family | 552 | 5,902 | 13,403 | |
Married w/Child | 534 | 4,131 | 10,654 | |
Single Male w/Child | 34 | 515 | 1,298 | |
Single Female w/Child | 158 | 2,602 | 6,259 |
Population Change Last Two Decades - Plus Projection
2000 | % | 2010 | % | 2020 | % | 2030 | |
---|---|---|---|---|---|---|---|
Mississippi | 2,844,658 | +4 | 2,967,297 | +3 | 3,066,382 | +1 | 3,104,159 |
DeSoto County | 107,199 | +50 | 161,252 | +9 | 175,321 | +5 | 184,201 |
Marshall County | 34,993 | +6 | 37,144 | +4 | 38,728 | +1 | 39,206 |
Tennessee | 5,689,283 | +12 | 6,346,105 | +9 | 6,886,369 | +7 | 7,393,069 |
Shelby County | 897,472 | +3 | 927,644 | +1 | 940,109 | +2 | 956,754 |
Total Working Age Population:
Total Households:
Total Working Age Population:
Total Households:
Total Working Age Population:
Total Households: