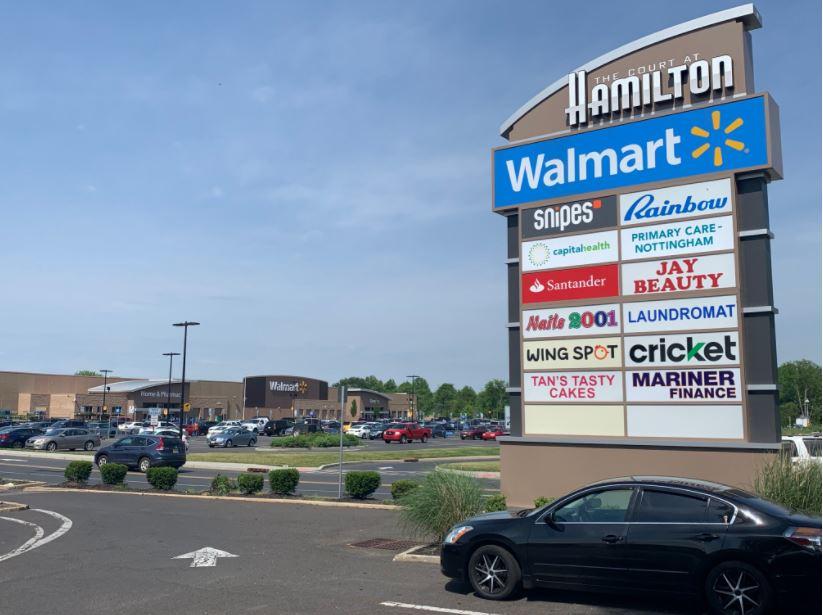
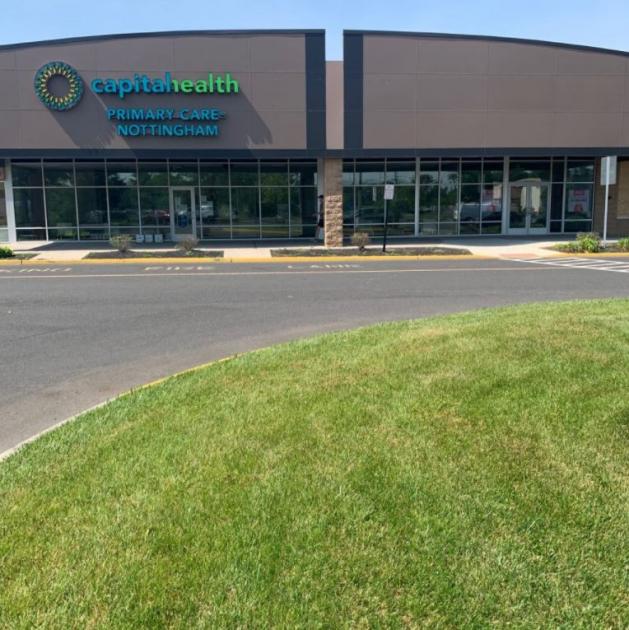
1-Mile | 3-Miles | 5-Miles | ||
---|---|---|---|---|
Total Population | 10,981 | 132,996 | 254,675 | |
Population Median Age | 38 | 38 | 38 | |
Population by Age | 0-9 Yrs | 1496 (13%) | 17093 (12%) | 30150 (11%) |
10-19 Yrs | 1133 (10%) | 16427 (12%) | 32960 (12%) | |
20-29 Yrs | 1820 (16%) | 19519 (14%) | 37713 (14%) | |
30-39 Yrs | 1328 (12%) | 19635 (14%) | 34598 (13%) | |
40-49 Yrs | 1604 (14%) | 17757 (13%) | 32663 (12%) | |
50-59 Yrs | 1407 (12%) | 17198 (12%) | 34695 (13%) | |
60-69 Yrs | 1062 (9%) | 14050 (10%) | 28044 (11%) | |
70+ Yrs | 1131 (10%) | 11317 (8%) | 23852 (9%) | |
Median HH Income | $68,659 | $58,602 | $66,843 | |
Total Household Income | < 24K | 394 (10%) | 10476 (22%) | 18909 (20%) |
25-49K | 804 (21%) | 9969 (21%) | 16595 (18%) | |
50-74K | 895 (23%) | 8121 (17%) | 14787 (16%) | |
75-99K | 437 (11%) | 6215 (13%) | 11432 (12%) | |
100-199K | 1088 (28%) | 9771 (20%) | 22183 (24%) | |
200K+ | 151 (4%) | 2319 (4%) | 6868 (7%) | |
Highest Education Level | No Diploma | 918 | 17133 | 24793 |
Diploma or GED | 2730 | 29907 | 52049 | |
Some College | 1699 | 17535 | 32714 | |
Assoc. Degree | 606 | 5115 | 10951 | |
Bachelors Degree | 1166 | 12745 | 30119 | |
Higher Degree | 364 | 7284 | 20763 | |
Total Housing Units | 3,964 | 53,547 | 102,760 | |
--Owner-Occupied | 2,161 | 25,545 | 53,150 | |
--Renter-Occupied | 1,609 | 21,325 | 37,624 | |
Owner-Occupied Values | < 100K | 196 | 5319 | 7437 |
100-199K | 825 | 7626 | 14327 | |
200-299K | 835 | 7082 | 16187 | |
300-399K | 248 | 4176 | 8645 | |
400-499K | 18 | 886 | 3501 | |
500K+ | 38 | 456 | 3053 | |
Total Working Age Population | 8,942 | 106,185 | 206,448 | |
In Work Force | 6,219 | 69,413 | 132,891 | |
Not In Work Force | 2,724 | 36,773 | 73,558 | |
Workforce Employed | 5,842 | 64,148 | 123,114 | |
Workforce Unemployed | 355 | 5,178 | 9,636 | |
Civlian Workforce | 6,198 | 69,326 | 132,751 | |
Military Workforce | 21 | 87 | 140 | |
Total Households | 3,770 | 46,870 | 90,774 | |
Family Households | 2,698 | 29,672 | 57,961 | |
Non-Family Households | 1,072 | 17,198 | 32,812 | |
Married Couple | 1,946 | 18,570 | 38,161 | |
Other Family | 752 | 11,102 | 19,800 | |
Married w/Child | 640 | 7,665 | 15,262 | |
Single Male w/Child | 67 | 943 | 1,730 | |
Single Female w/Child | 335 | 4,410 | 7,552 |
Population Change Last Two Decades - Plus Projection
2000 | % | 2010 | % | 2020 | % | 2030 | |
---|---|---|---|---|---|---|---|
New Jersey | 8,414,350 | +4 | 8,791,894 | +4 | 9,132,700 | +4 | 9,530,900 |
Burlington County | 423,394 | +6 | 448,734 | 0 | 450,000 | +3 | 464,900 |
Mercer County | 350,761 | +4 | 366,513 | +3 | 379,000 | +5 | 397,400 |
Middlesex County | 750,162 | +8 | 809,858 | +8 | 873,400 | +7 | 932,200 |
Pennsylvania | 12,281,054 | +3 | 12,702,379 | +4 | 13,230,170 | +4 | 13,759,594 |
Bucks County | 597,635 | +5 | 625,249 | +1 | 629,420 | +1 | 637,730 |
Total Working Age Population:
Total Households:
Total Working Age Population:
Total Households:
Total Working Age Population:
Total Households: