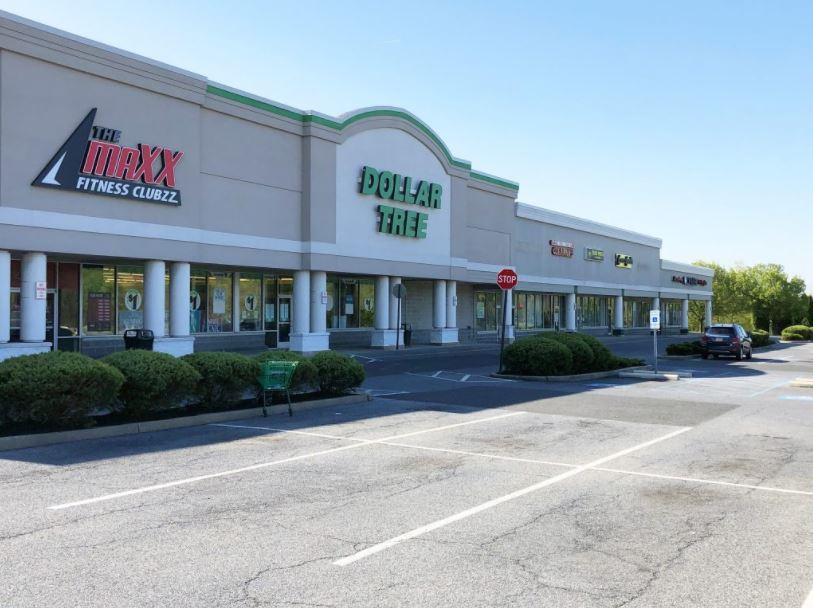
1-Mile | 3-Miles | 5-Miles | ||
---|---|---|---|---|
Total Population | 3,746 | 66,041 | 183,794 | |
Population Median Age | 40 | 38 | 38 | |
Population by Age | 0-9 Yrs | 512 (13%) | 6847 (10%) | 22049 (11%) |
10-19 Yrs | 474 (12%) | 9660 (14%) | 25789 (14%) | |
20-29 Yrs | 295 (7%) | 12213 (18%) | 29410 (16%) | |
30-39 Yrs | 553 (14%) | 8543 (12%) | 25128 (13%) | |
40-49 Yrs | 421 (11%) | 7364 (11%) | 20513 (11%) | |
50-59 Yrs | 568 (15%) | 7717 (11%) | 22382 (12%) | |
60-69 Yrs | 512 (13%) | 6909 (10%) | 19794 (10%) | |
70+ Yrs | 411 (10%) | 6788 (10%) | 18728 (10%) | |
Median HH Income | $88,109 | $54,241 | $53,306 | |
Total Household Income | < 24K | 170 (12%) | 5538 (22%) | 15180 (22%) |
25-49K | 174 (12%) | 5847 (23%) | 17058 (25%) | |
50-74K | 210 (14%) | 4394 (17%) | 12815 (18%) | |
75-99K | 277 (19%) | 2774 (11%) | 8311 (12%) | |
100-199K | 409 (29%) | 4522 (18%) | 11233 (16%) | |
200K+ | 159 (11%) | 1357 (5%) | 3442 (5%) | |
Highest Education Level | No Diploma | 104 | 4862 | 17374 |
Diploma or GED | 607 | 14549 | 42562 | |
Some College | 378 | 7465 | 20817 | |
Assoc. Degree | 216 | 3343 | 9997 | |
Bachelors Degree | 641 | 6831 | 17596 | |
Higher Degree | 593 | 5022 | 12452 | |
Total Housing Units | 1,490 | 26,689 | 73,501 | |
--Owner-Occupied | 1,203 | 13,203 | 37,065 | |
--Renter-Occupied | 198 | 11,229 | 30,973 | |
Owner-Occupied Values | < 100K | 68 | 1698 | 5335 |
100-199K | 366 | 6688 | 18410 | |
200-299K | 205 | 2202 | 7278 | |
300-399K | 261 | 932 | 2559 | |
400-499K | 138 | 621 | 1365 | |
500K+ | 165 | 1063 | 2119 | |
Total Working Age Population | 2,977 | 55,049 | 147,750 | |
In Work Force | 1,914 | 32,854 | 91,733 | |
Not In Work Force | 1,063 | 22,195 | 56,017 | |
Workforce Employed | 1,786 | 30,955 | 85,542 | |
Workforce Unemployed | 128 | 1,884 | 6,118 | |
Civlian Workforce | 1,914 | 32,839 | 91,660 | |
Military Workforce | 0 | 15 | 73 | |
Total Households | 1,401 | 24,433 | 68,038 | |
Family Households | 1,078 | 14,343 | 43,191 | |
Non-Family Households | 323 | 10,090 | 24,847 | |
Married Couple | 988 | 9,364 | 27,148 | |
Other Family | 90 | 4,979 | 16,043 | |
Married w/Child | 407 | 3,493 | 9,974 | |
Single Male w/Child | 1 | 618 | 2,206 | |
Single Female w/Child | 58 | 1,906 | 7,172 |
Population Change Last Two Decades - Plus Projection
2000 | % | 2010 | % | 2020 | % | 2030 | |
---|---|---|---|---|---|---|---|
Pennsylvania | 12,281,054 | +3 | 12,702,379 | +4 | 13,230,170 | +4 | 13,759,594 |
Bucks County | 597,635 | +5 | 625,249 | +1 | 629,420 | +1 | 637,730 |
Lehigh County | 312,090 | +12 | 349,497 | +5 | 365,909 | +5 | 385,431 |
Northampton County | 267,066 | +11 | 297,735 | +4 | 309,231 | +4 | 321,338 |
Total Working Age Population:
Total Households:
Total Working Age Population:
Total Households:
Total Working Age Population:
Total Households: